Introduction
The OWASP Top 10 has not called out denial of service (DoS) attacks as a top threat to web applications for over twenty years. Published way back in 2004, the second OWASP Top 10 list awarded the number nine spot (known as A9) to “Application Denial of Service” attacks. Since the 2004 edition, however, threats posed by DoS attacks have been rolled up into other categories such as Broken Access Control.
We think it may be time for DoS to make a reappearance in the forthcoming 2024 OWASP Top 10.
Through a combination of geopolitical unrest, trivially exploited vulnerabilities, and the emergence of new botnets, denial of service incidents have exploded since our 2023 DDoS Attack Trends report in February 2023. With the seemingly unstoppable growth in denial-of-service attack frequency and sizes, it begs the question: are we as an industry doing enough to thwart the risk and impact of DDoS?
By combining analysis of the DoS incidents encountered by the F5 Distributed Cloud service with insights from security engineers in the Security Incident Response Team (SIRT) and the Threat Analytics and Reporting (TAR) teams, we have been able to paint a detailed and insightful picture into the current state of DoS attacks being used by threat actors all over the world. This report focuses on the attacks and trends seen during 2023 but includes a brief insight into new attacks and trends observed in the first half of 2024.
Executive Summary
Distributed denial of service attacks have seen enormous growth regardless of which way you measure them. Frequency of incidents, average peak bandwidth, and complexity of attacks are all increasing, and it appears that no organization is safe.
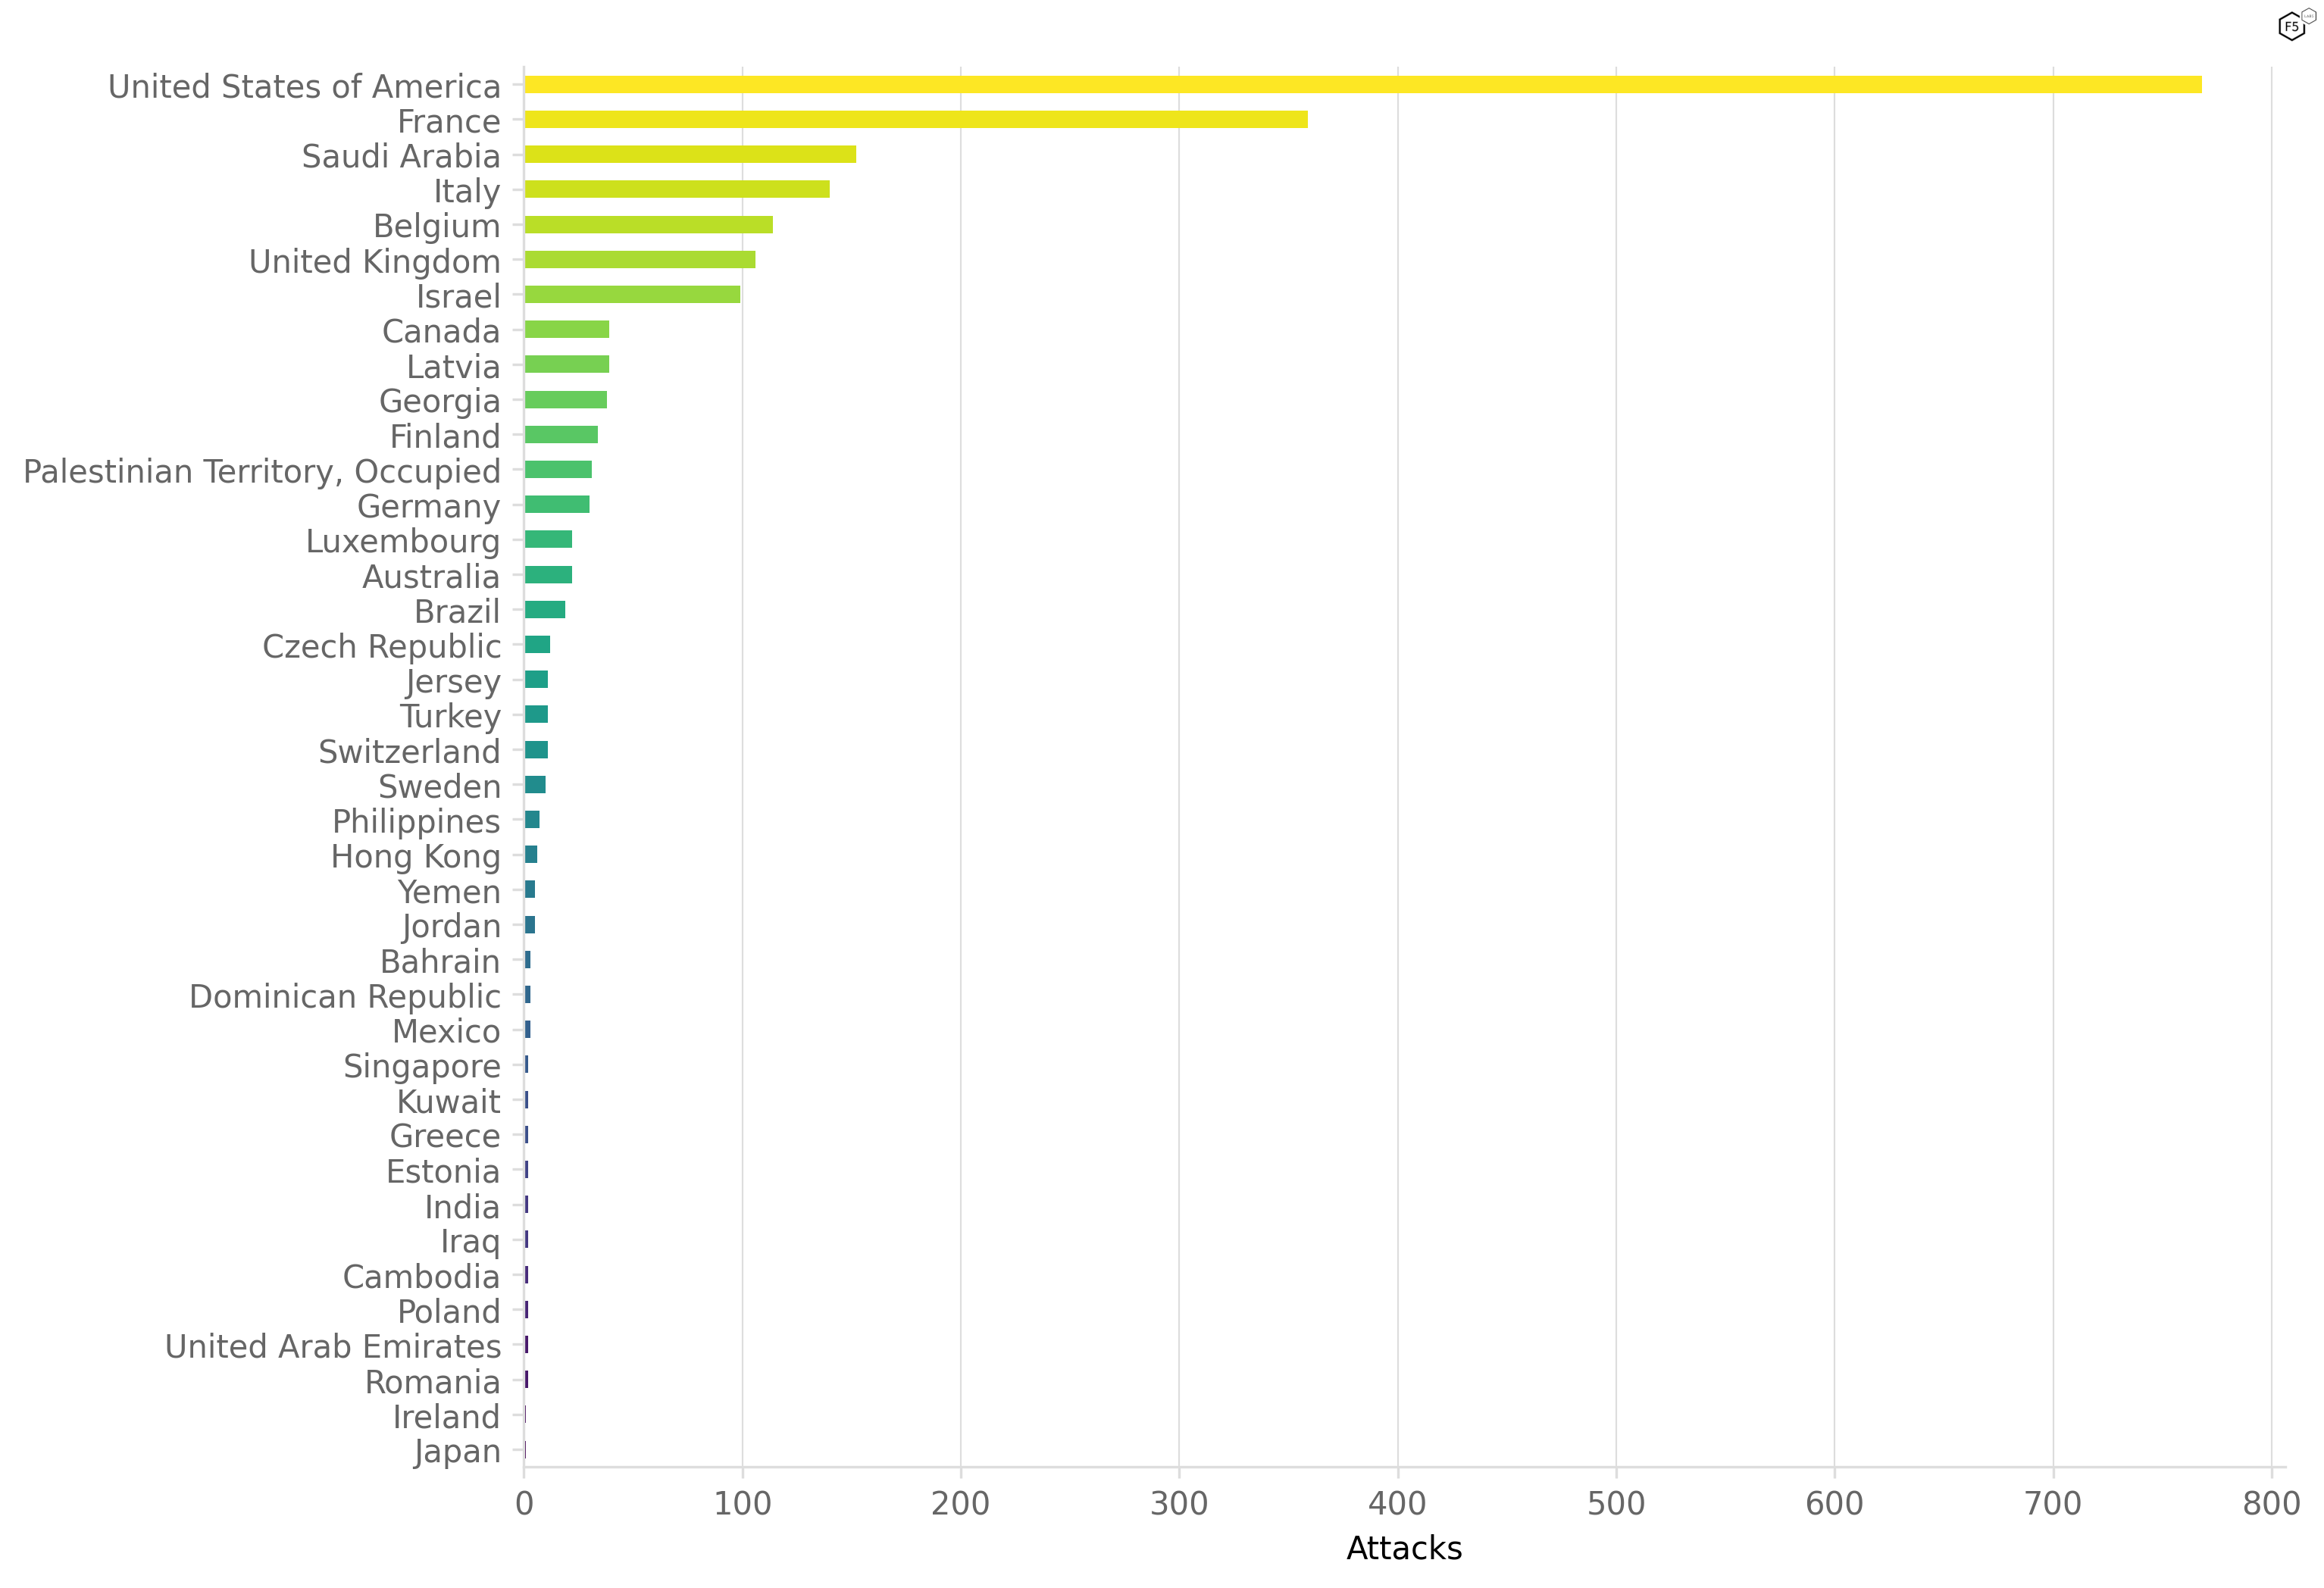
Organizations are being attacked in almost equal measure, regardless of their geographic location, the size of the company, or the industry to which they are most closely aligned, though there are some exceptions to this. Notably America, France, and the UK, saw significant spikes in DDoS activity which align closely to geopolitical events playing out on the global stage. This reinforces the understanding that unskilled but politically motivated individuals are increasingly making use of DDoS servers (stressors) and botnets in an attempt to make their voice heard.
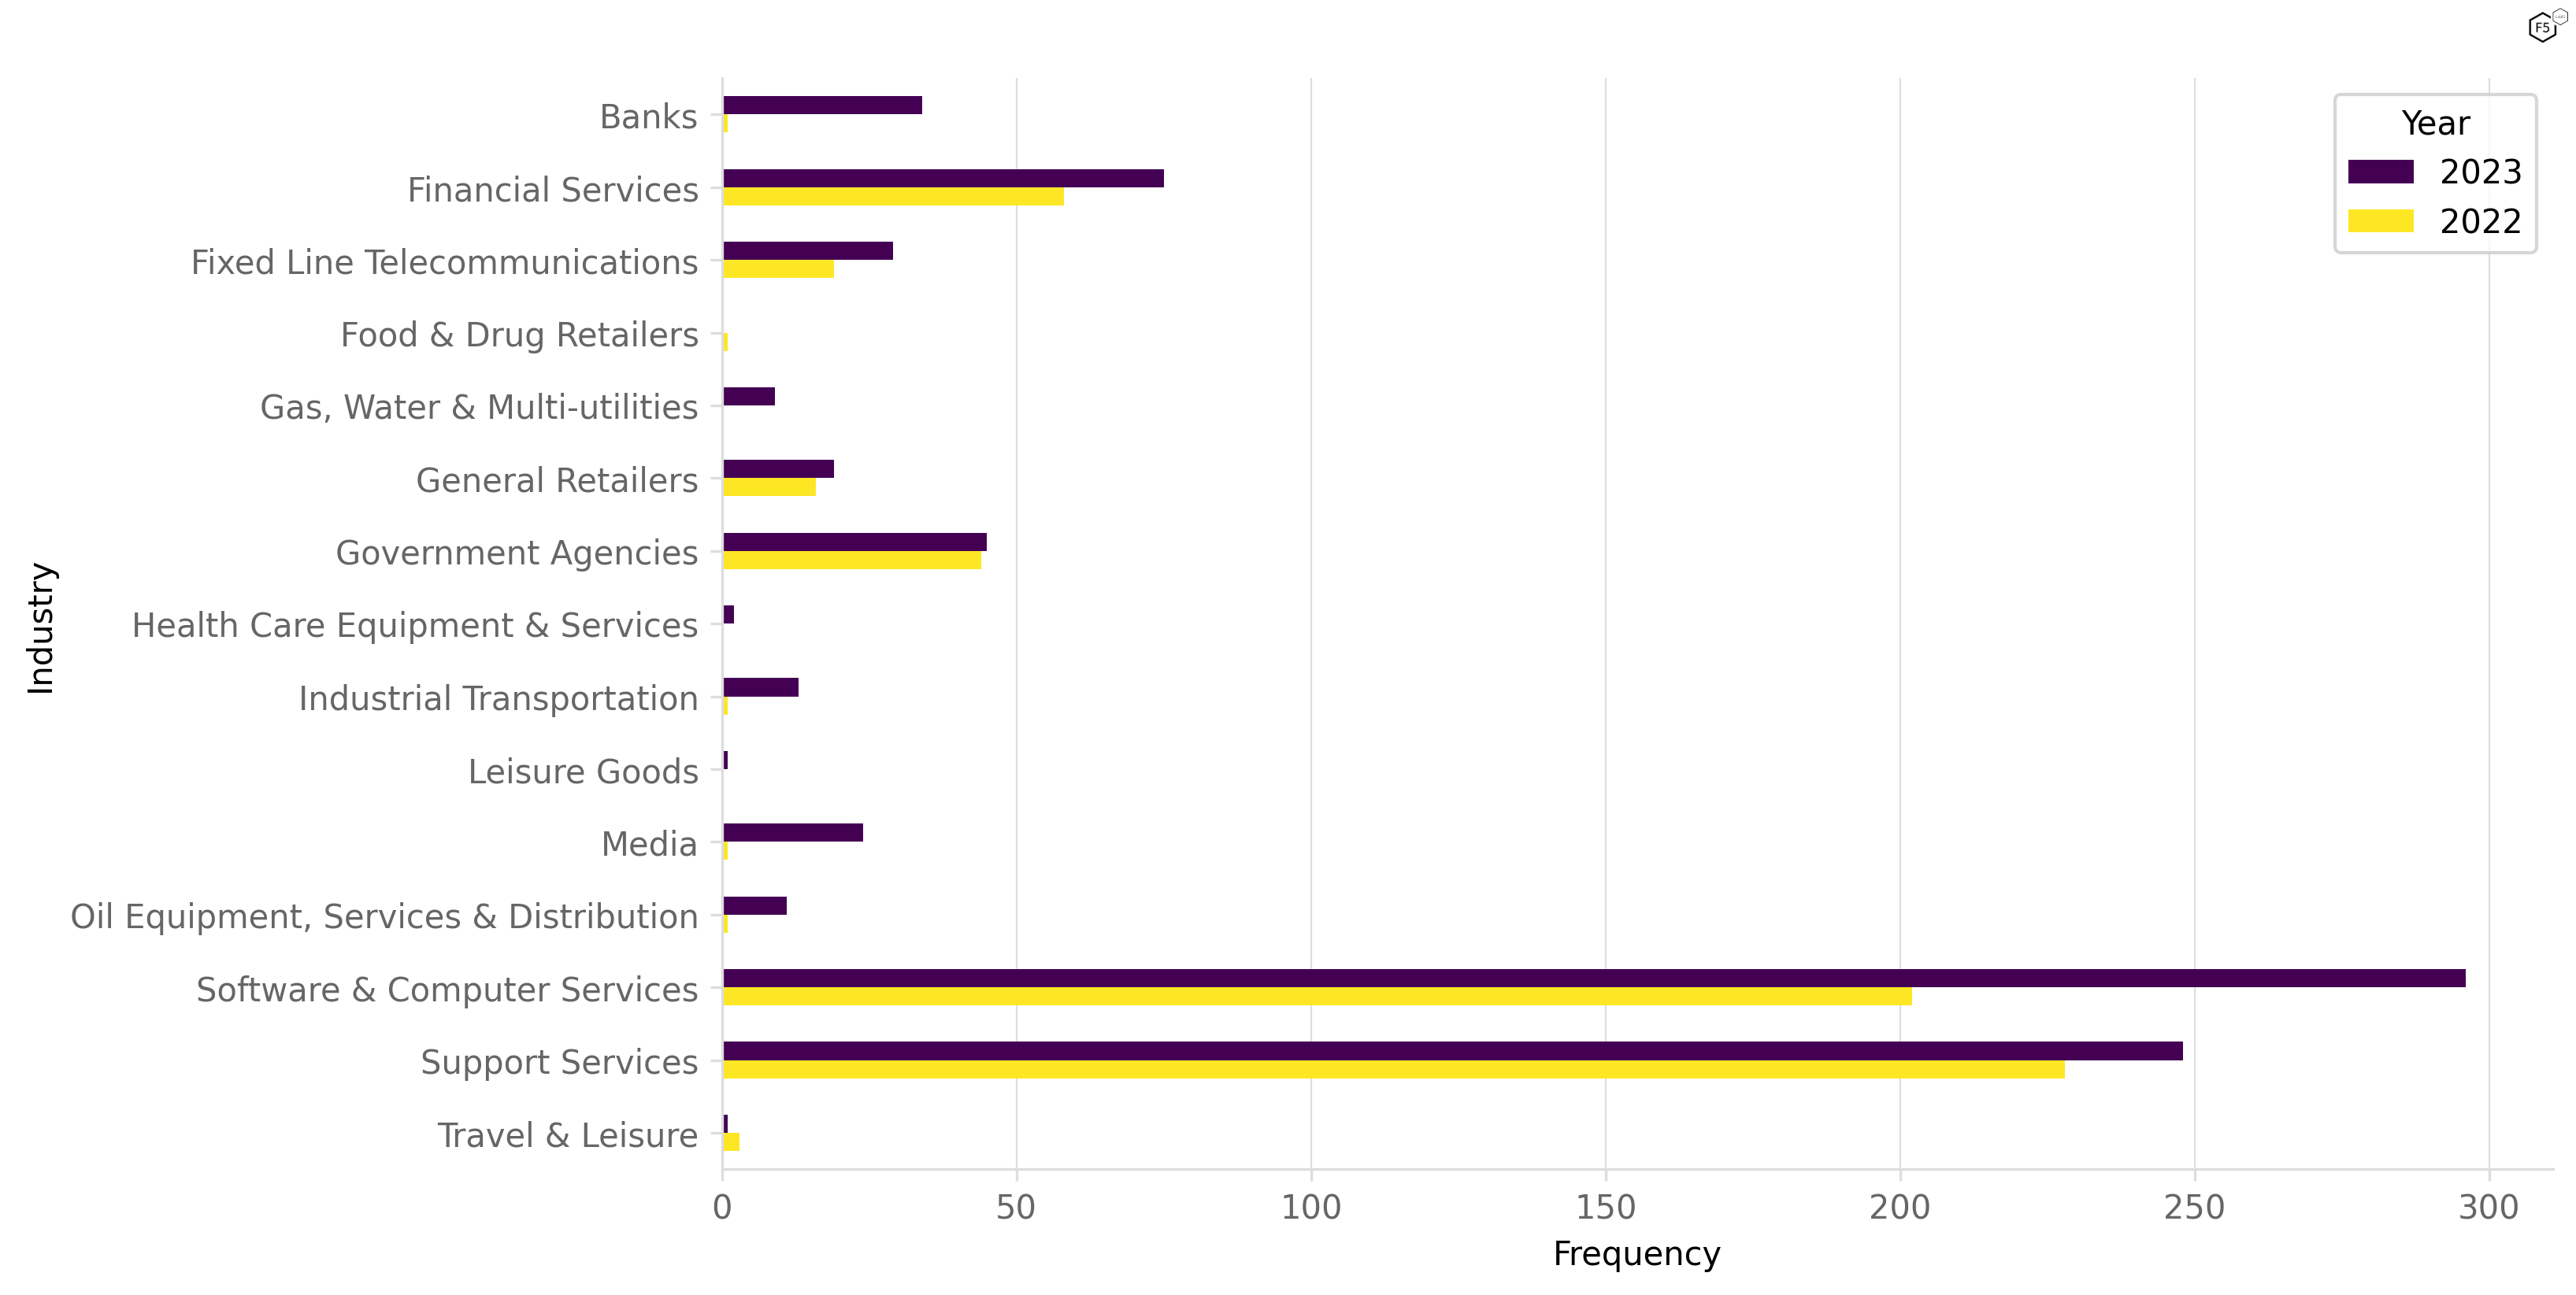
The Software and Computer Services industry saw the most activity throughout 2023, with Telecommunications also suffering persistent attacks. Virtually all sectors saw significant growth in attacks in 2023 compared with the previous year. Software and Computer services attacks doubled, but the Telecommunications and Banking industries saw explosive growth with each seeing an approximate fivefold increase in incidents.
Other notable findings from this report include:
- Attacks more than doubled in 2023 compared with 2022, growing almost 112%.
- The biggest attack of 2023 was in March and peaked at 1Tbps, targeting an organization in the Support Services1 sector.
- That same organization also suffered the most attacks across the year, 187 in total.
- The mean number of attacks withstood was 11, meaning each organization dealt with a denial-of-service incident almost once month.
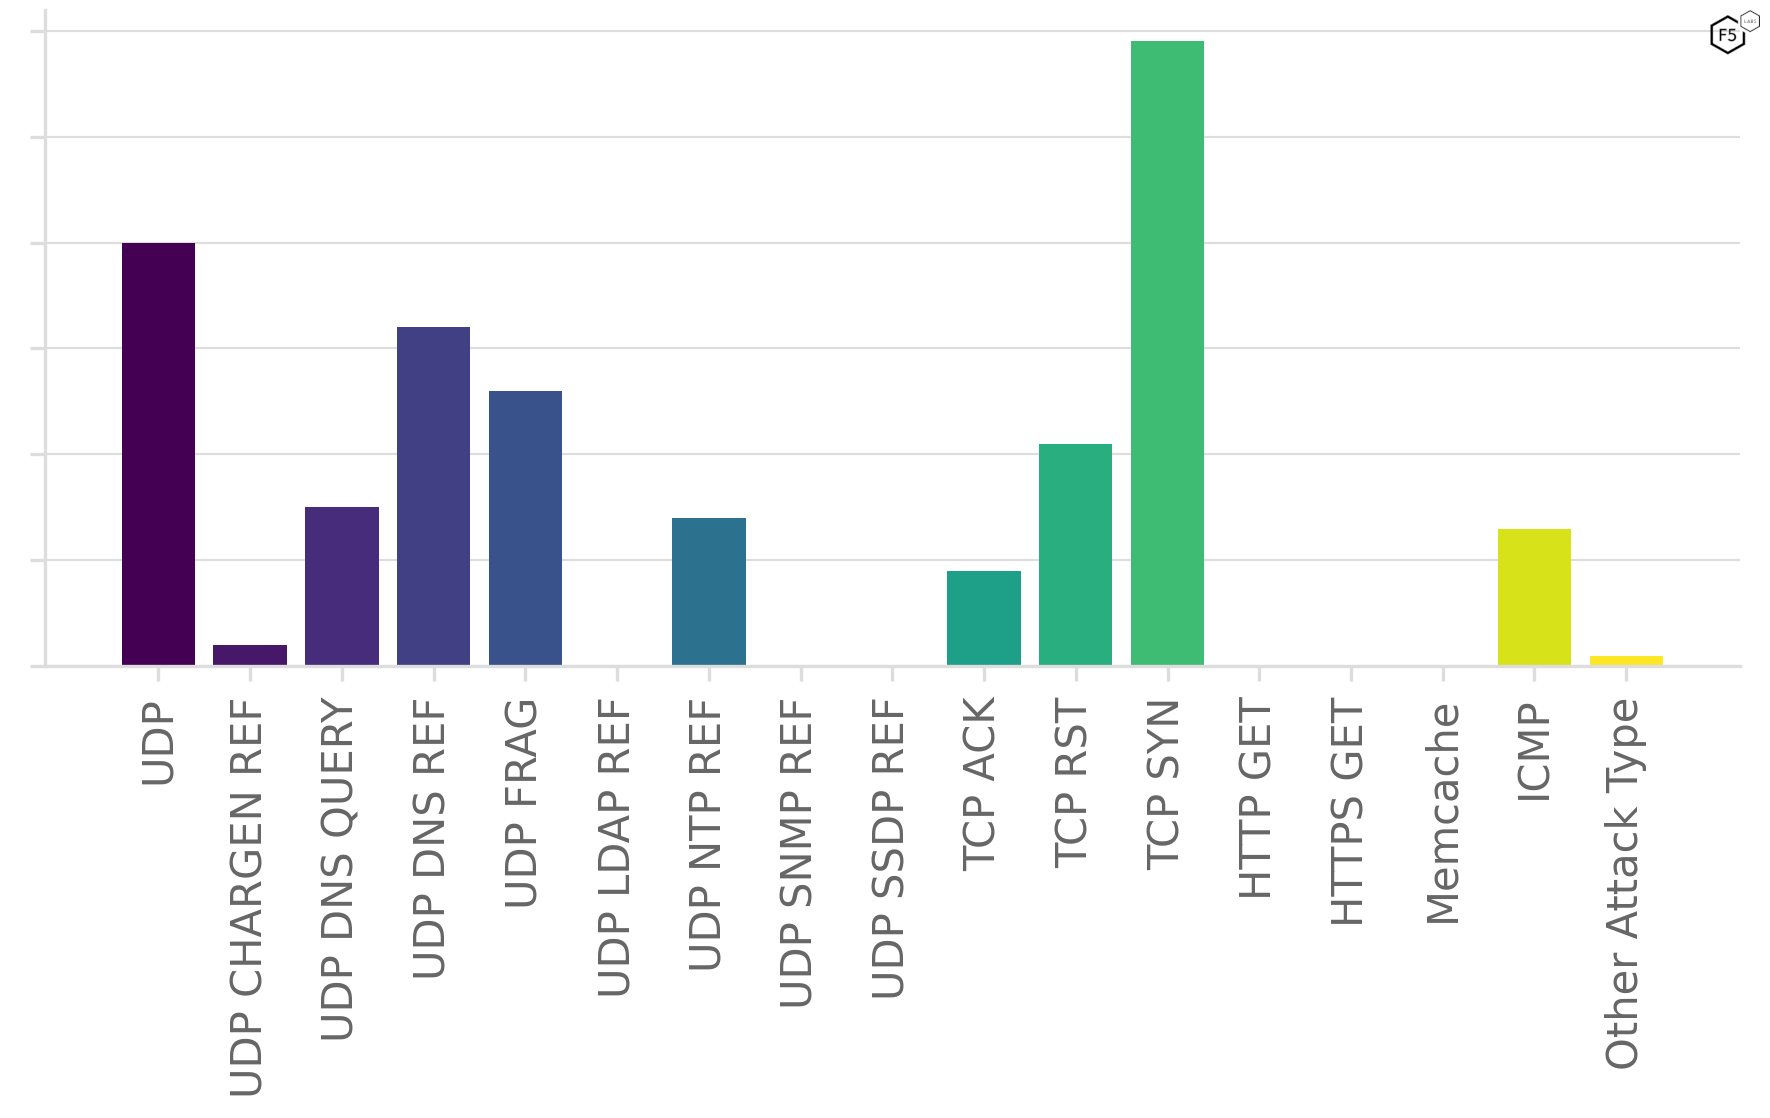
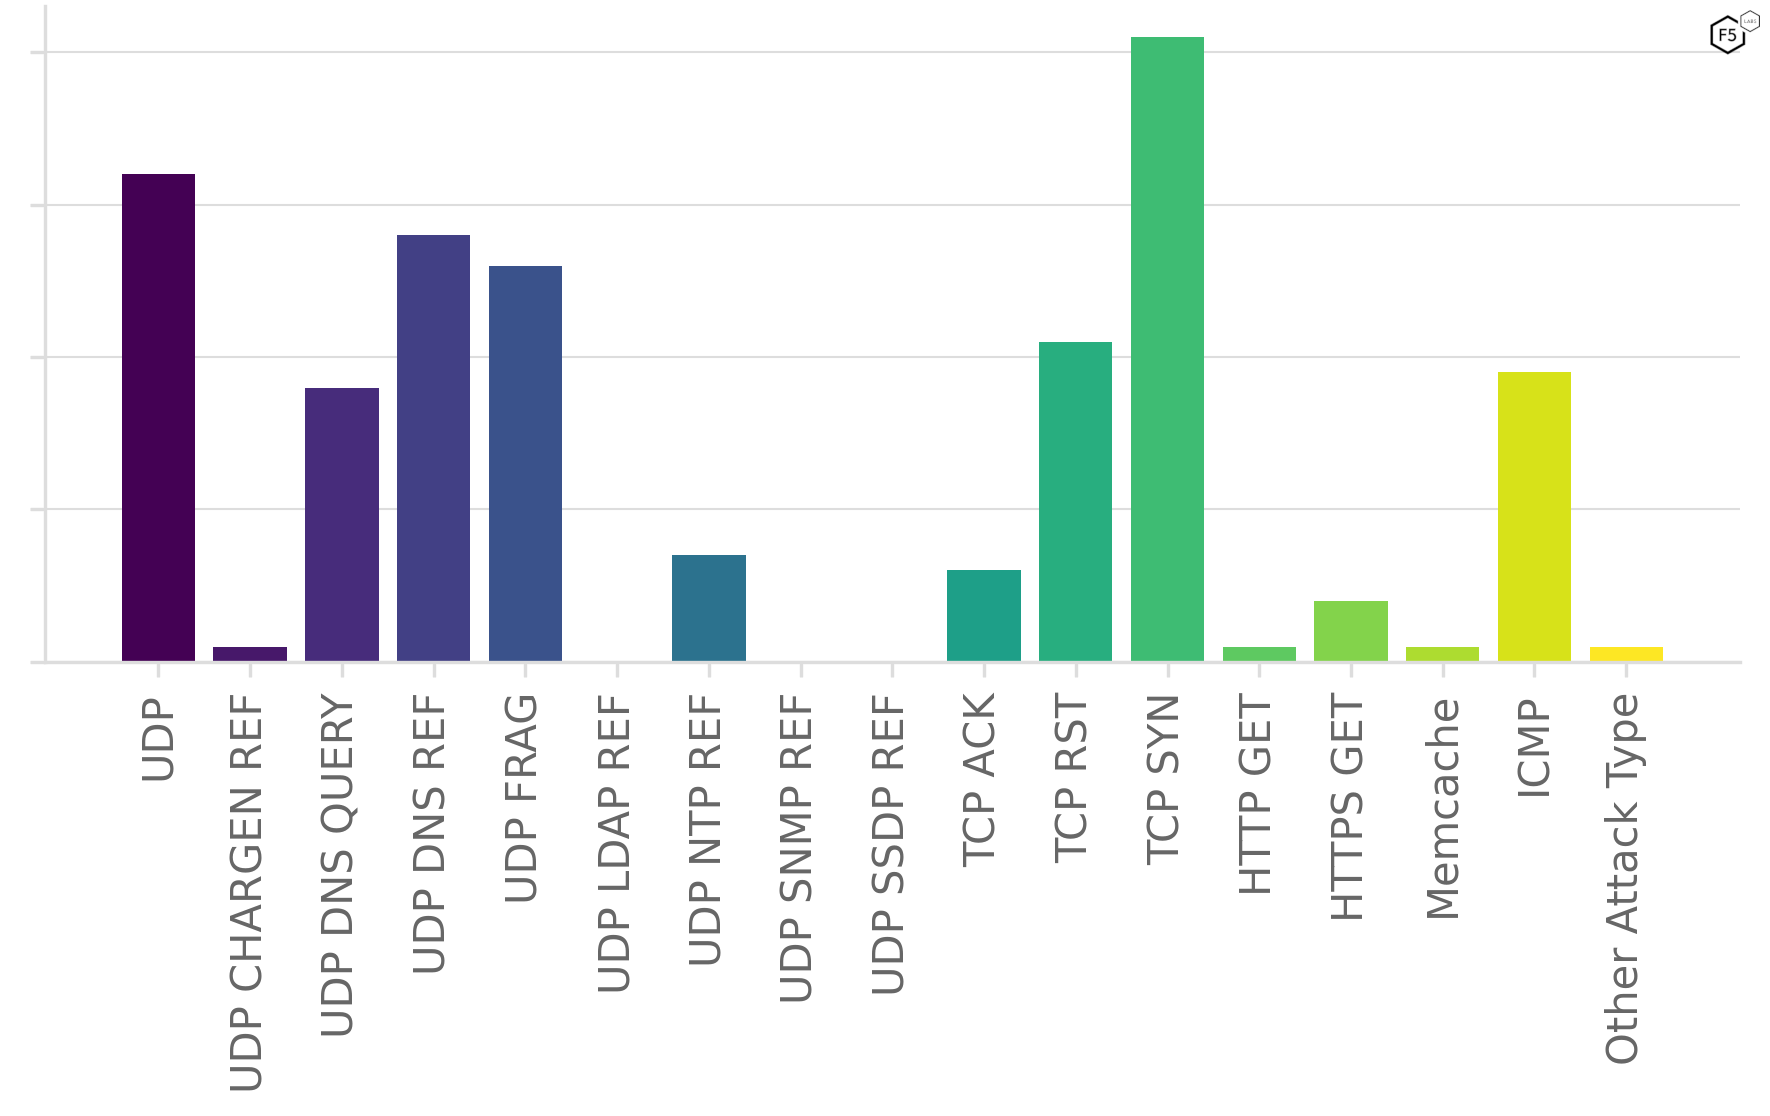
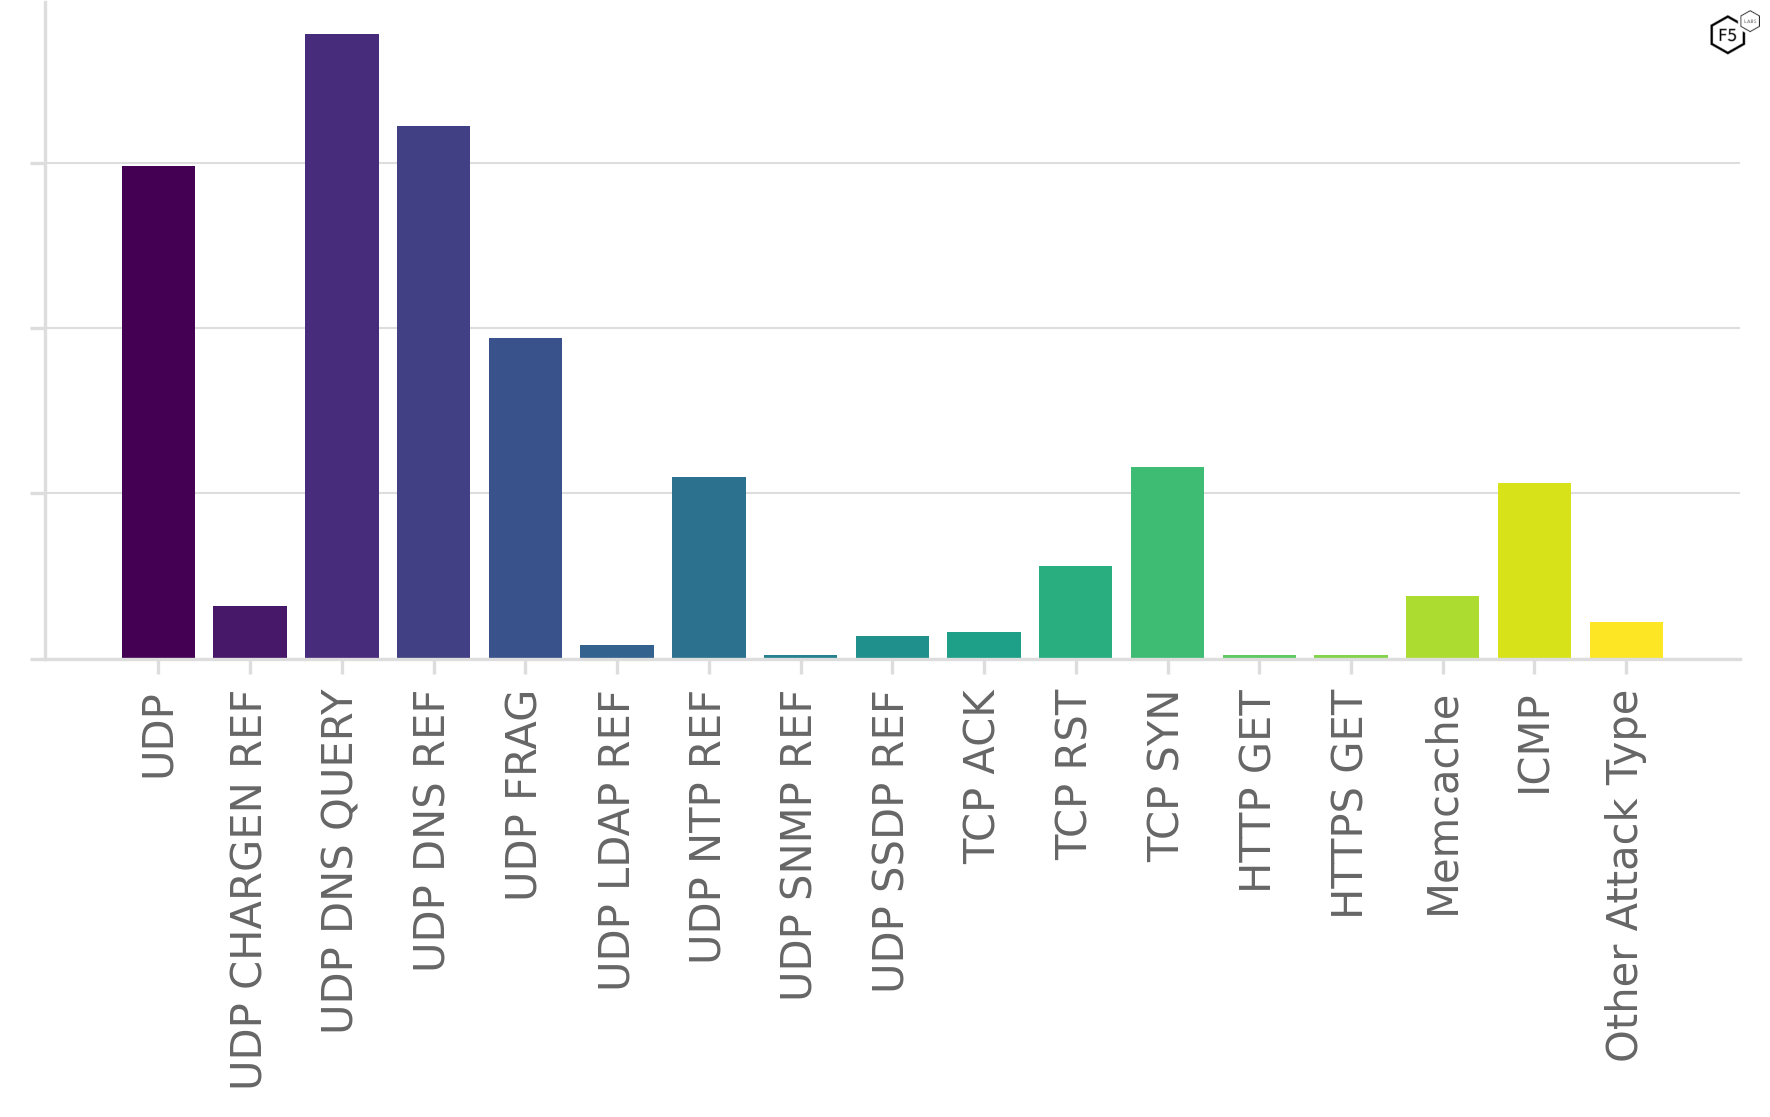
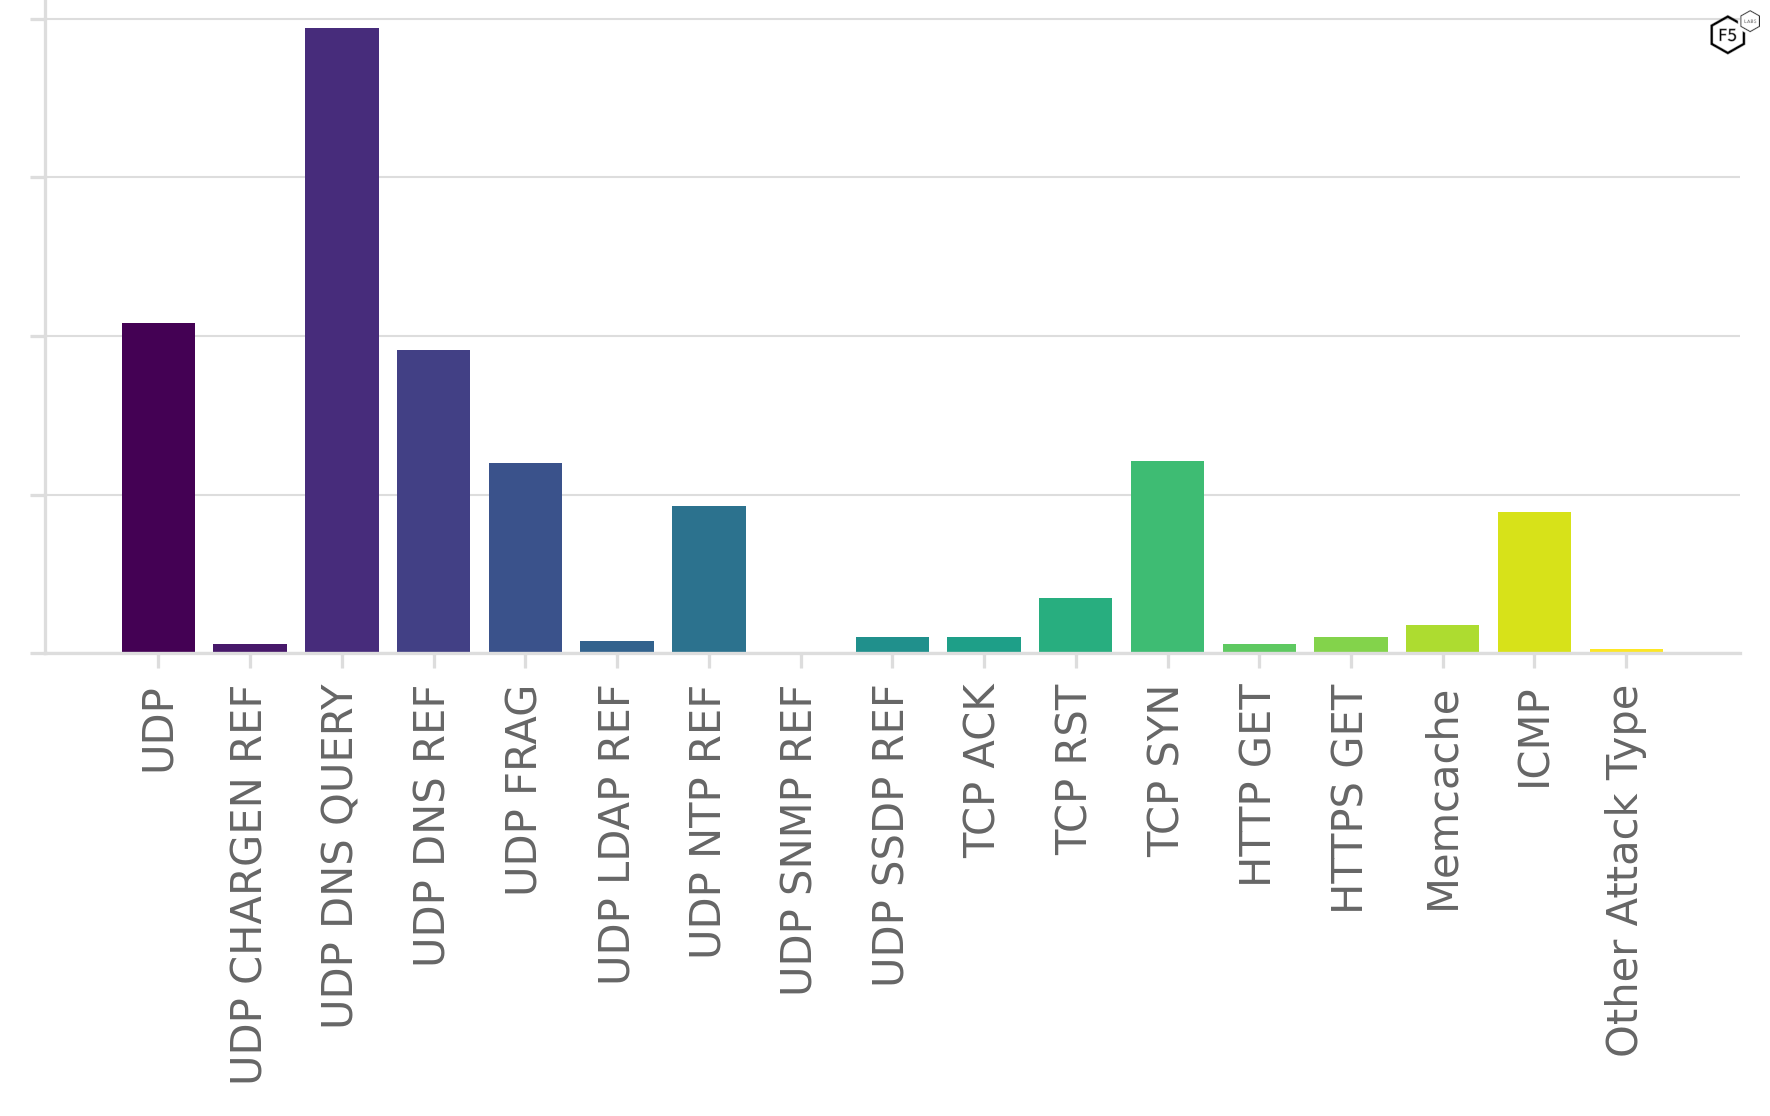
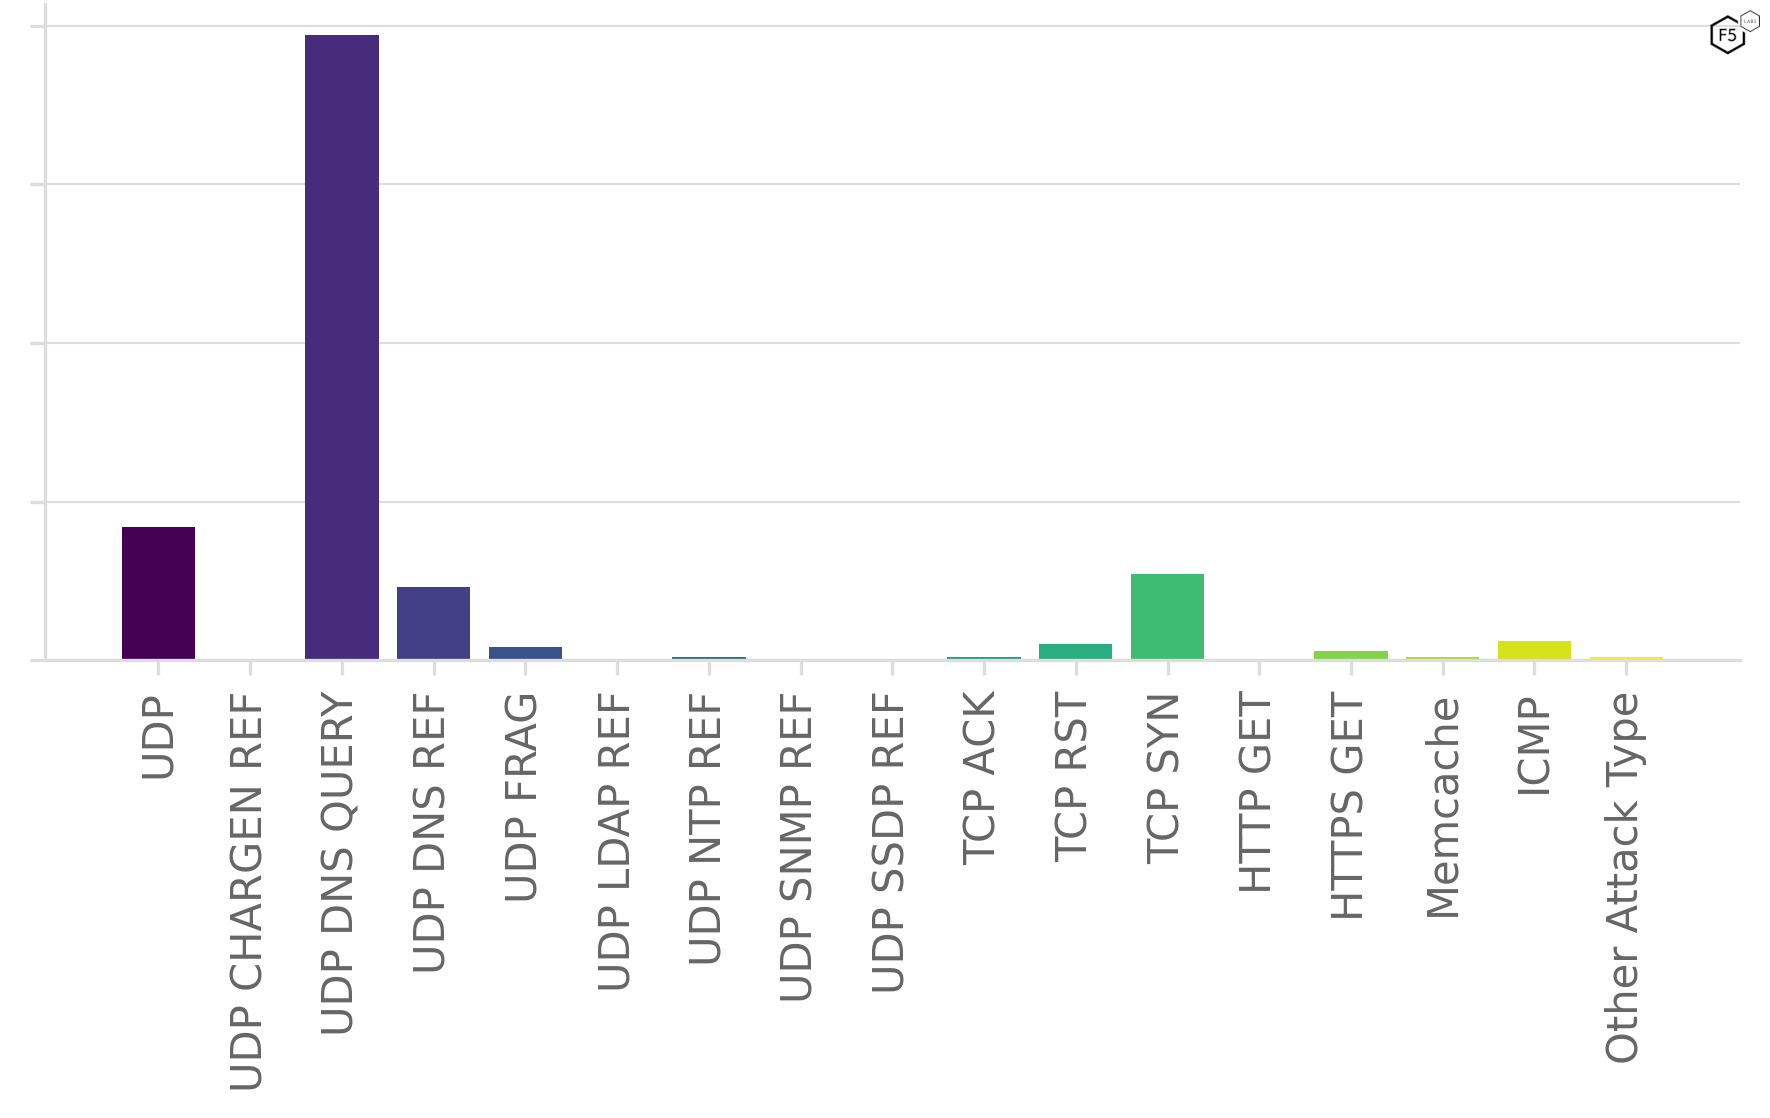
- Overall, DNS QUERY attacks were responsible for the vast majority of overall DDoS attacks being seen in 26% of events through 2023.
- Individual industries saw some differences, with BFSI in particular seeing more TCP SYN floods that anything else.
- Software and Computer Services was the most attacked industry in 2023 comprising 36% of all attacks. Telecommunications took second place, followed up Support Services, BFSI, and Media.
- Telecoms saw the biggest jump in the number of attacks it faced.
- Attack sizes remained high throughout the year with attacks consistently above 100Gbps, and many over 500Gbps. February was the outlier with the biggest attack of that month reaching less than 10Gbps.
- Recent activity seen in the first half of 2024 points to continued growth with threat actors increasing their efforts to compromise IoT devices and subsume them into their botnets.
DDoS is Dead! Long Live DDoS!
Denial of Service attacks are approaching their middle age. It is almost 30 years since the first recorded attack which targeted the internet service provider Panix in September 1996. Almost three decades later we continue to see DoS evolve with emerging attack vectors affecting new protocols (HTTP/2) and old ones (DNS), alike.
Although the latter half of 2022 and the start of 2023 saw law enforcement making significant progress in the battle against DDoS-as-a-Service providers, the rapid recovery of organized crime and the announcement of new DoS attack vectors means that the relative calm was short lived.
One Step Forward: Global Takedowns
A large proportion of global denial of service traffic originates from malicious DDoS-as-a-Service platforms, hosted and run by organized crime gangs. It makes sense, therefore, that law enforcement agencies invest significant effort in to bringing down these so-called “booters” or “stressors”. This is exactly what happened in December 2022. Europol, working with agencies from the United States, the United Kingdom, the Netherlands, Poland, and Germany, took down around fifty of the world’s biggest stressors (Figure 1).2

Figure 1. Screenshot of DDoS-as-a-Service website after seizure by Europol
The effect of this operation can’t be overstated. The decline in DDoS traffic in the months after the takedowns was profound, as we’ll uncover as we dive in the numbers later in this report. February 2023 was, in particular, a very quiet month. Attack frequency was down considerably, as were the size of attacks. The largest attack seen in February measured only 7 Gbps.
Threat actors recovered quickly, however, with March witnessing the largest attack of the year coming in at 1 Tbps.
International take-down operations, such as those led by Europol, continue to be an important part of combatting organized cybercrime. One stressor taken down in the December 2022 operation was believed to have been responsible for 30 million attacks. For the most part, however, the focus of law enforcement is on the individuals who break the law, not the devices used to carry out the attacks. Websites and domains are also seized, but until the compromised devices which make up a DDoS botnet are taken care of, they remain in place just waiting for a new crime gang to co-opt them for their own purposes.
One Step Back: The Mozi DDoS Botnet
This report focuses on DDoS attacks which took place over the course of 2023. We would be remiss, however, to not address the huge rise in DDoS activity seen at the start of 2024. As recently covered in the April 2024 edition of the Sensor Intel Series, threat actors have been using new vulnerabilities to build DDoS botnets from TP-Link and Netgear routers, among others.
CVE-2023-1389, a command injection vulnerability in the firmware for the TP-Link Archer AX21 Wi-Fi routers accounts for 40% of malicious scanning activity during April 2024 (see Figure 2). Exploit code for this CVE indicates that attackers are using it to take over vulnerable devices and subsume them into the Mozi botnet.
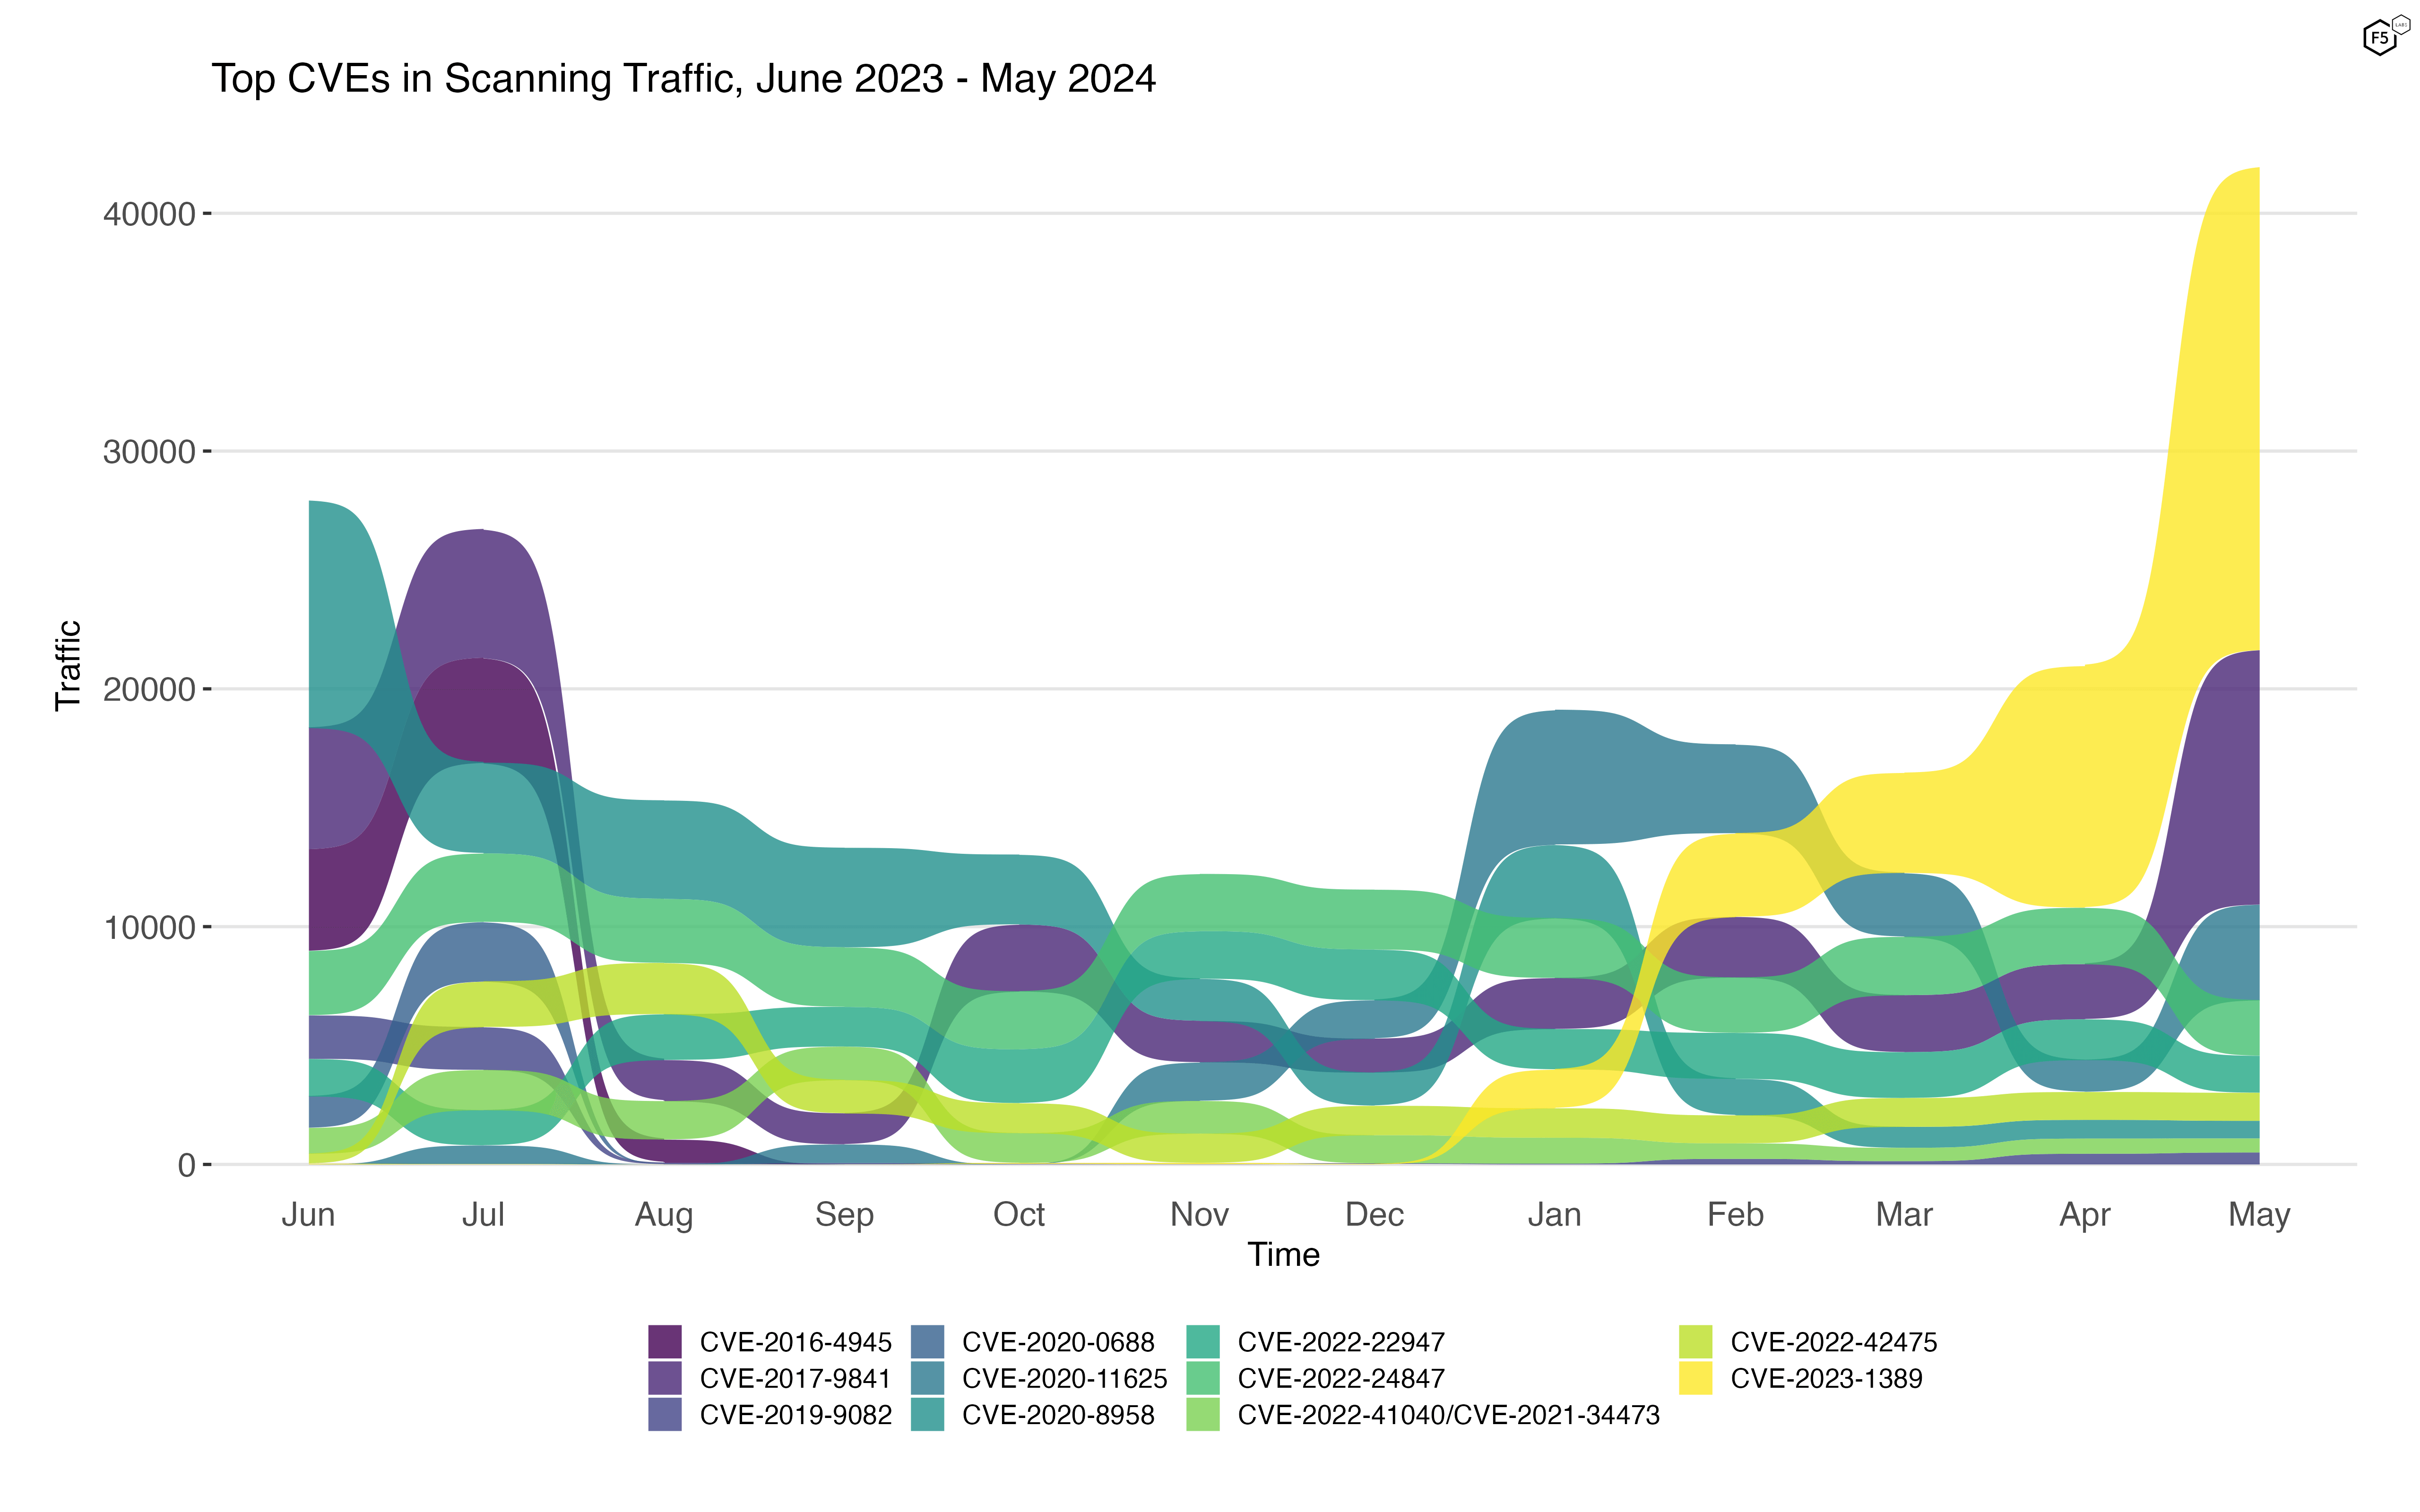
Figure 2: Most targeted CVEs by malicious internet-wide scans
The Mozi botnet has been documented as able to conduct HTTP, TCP, UDP, and other attacks. More information can be found in the April 2024 Sensor Intel Series article.
And Another Step Back: Emerging DDoS Attack Vectors
HTTP/2 Abuse
The relatively new HTTP/2 protocol (new in internet terms, since the protocol is now almost ten years old) recently came under the spotlight of security researchers. The latter half of 2024 and start of 2024 saw not one, but two, new vulnerabilities which could create denial-of-service conditions even when HTTP/2 implementations followed the RFC to the letter. This is a big deal. Oftentimes it is a specific implementation of an RFC which is found to be vulnerable. In both following cases involving HTTP/2, however, all implementations are potentially vulnerable since the RFC itself did not consider all potential vectors of abuse.
HTTP/2 Rapid Reset Attack
The first HTTP/2 denial-of-service vulnerability, eventually published under CVE-2023-44487, was first discovered by Google after mitigating the largest application layer attacks ever seen. It is well defined by the CERT-EU security advisory:1
The vulnerability exploits a weakness in the HTTP/2 protocol, allowing attackers to generate hyper-volumetric DDoS attacks. The attack involves sending a large number of HTTP/2 streams and immediately cancelling them, creating a cost asymmetry between the client and server. The attacker exploits the RST_STREAM and GOAWAY frames of the HTTP/2 protocol to manipulate the connection. This leaves the server doing significant work for cancelled requests while the client pays almost no costs.
HTTP/2 Continuation Frame Attack
The second HTTP/2 DoS vulnerability was announced in May 2024 and, for anyone that remembers it, shares a theme with the Slow Post denial of service attack method.2
The binary HTTP/2 protocol features multiple types of ‘frames’. Some are used as Headers, others contain Data to be sent between the client and server. Other frame types also exist and one of them is known as a Continuation frame. This is used to signal to the server that the client has more data to send so the connection should be left open. A malicious HTTP/2 client is able to send an arbitrary number of Continuation frames to the server and exhaust its available memory. The F5 DevCentral community has a great write up on HTTP/2 Continuation Frame Attacks.
The CERT Coordination Center details Vulnerability Note VU#421644 and it is this article that should be used to look for CVEs against specific HTTP/2 implementations.3
Loop DoS
Attackers making use of UDP floods often benefit from the ability to spoof the source IP address which results in ineffectual IP based blocking. UDP packets, however, still require that traffic is generated from a malicious or compromised clients (zombies) in a botnet. Loop DoS, by contrast, needs no such botnet. A single malicious request to Alice results in a flood of traffic to Bob. Bob then responds to Alice, generating yet more unwanted traffic.4 Essentially, Alice and Bob are tricked into attacking each. Despite this potential attack vector being known since 1996, it was only revealed as a practical attack method in March 2024 with protocols such TFTP, DNS, NTP, Echo and Chargen open to exploit.5 A reported 300,000 servers were potentially vulnerable to this attack.6
DNSbomb
As if DNS hasn’t already been exploited enough for denial of service attack vectors (such as NXDOMAIN attacks as well as DNS reflection floods) yet another exploit was revealed for this much beleaguered protocol. Just as with the HTTP/2 based attacks, this method exploits not a vulnerability, but deliberate mechanisms defined within the RFC 1035 specification.
Researchers determined that by making use of availability, security, and reliability features of DNS, it is possible to accumulate DNS queries such that all responses are let loose at once in “pulsing bursts”, which could result in a potential denial of service situation. Individual DNS vendors have issued their own CVEs but an industry-wide CVE was also published under CVE-2024-33655.7
2023 DDoS Attack Trends
After slow but marked decline in DoS attacks over recent years, 2023 saw a staggering increase compared with 2022. DDoS attacks have not only become more prevalent, in part due to their commoditisation and ease of use, but also due to rising global tensions and the ease with which hacktivists can launch an attack.
DDoS Attacks Explode in 2023
The global map shown in Figure 3 provides a glanceable view of the attacks seen by F5 Distributed Cloud over the course of 2023. While the number of attacks encountered by each region appears to vary drastically, the frequency of incidents is directly proportional to the number of customers in any given region. What does mean? Regardless of the postal address of an organization’s headquarters, or the virtual address of its IPv4 space, attackers care not for geographical boundaries. While individual counties do see more incidents than others, no one continent is worse than any other when averaging out countries in that region. We dive in to regional and country-level comparisons later in this report.

Figure 3: Regional comparison of DDoS attack frequency and peak bandwidth
Looking at total incidents, we found that DDoS attacks more than doubled over 2023, exploding from just over 1,000 in 2022 to more than 2,100 a year later (see Figure 4).
The mean number of attacks each organization faced was just over 11 across 2023, almost one a month. Needless to say, some businesses faced more attacks than others. One unfortunate Software & Computer Services firm withstood a staggering 127 attacks over the course of the year. However, this was far from the most attacked organization. One company stole the unenviable crown for most targeted, suffering a whopping 187 individual DDoS incidents in 2023. This company, found in the Support Services industry, was also unlucky enough to be the victim of the largest attack we saw in the year.
Average Peak Attack Sizes Grow
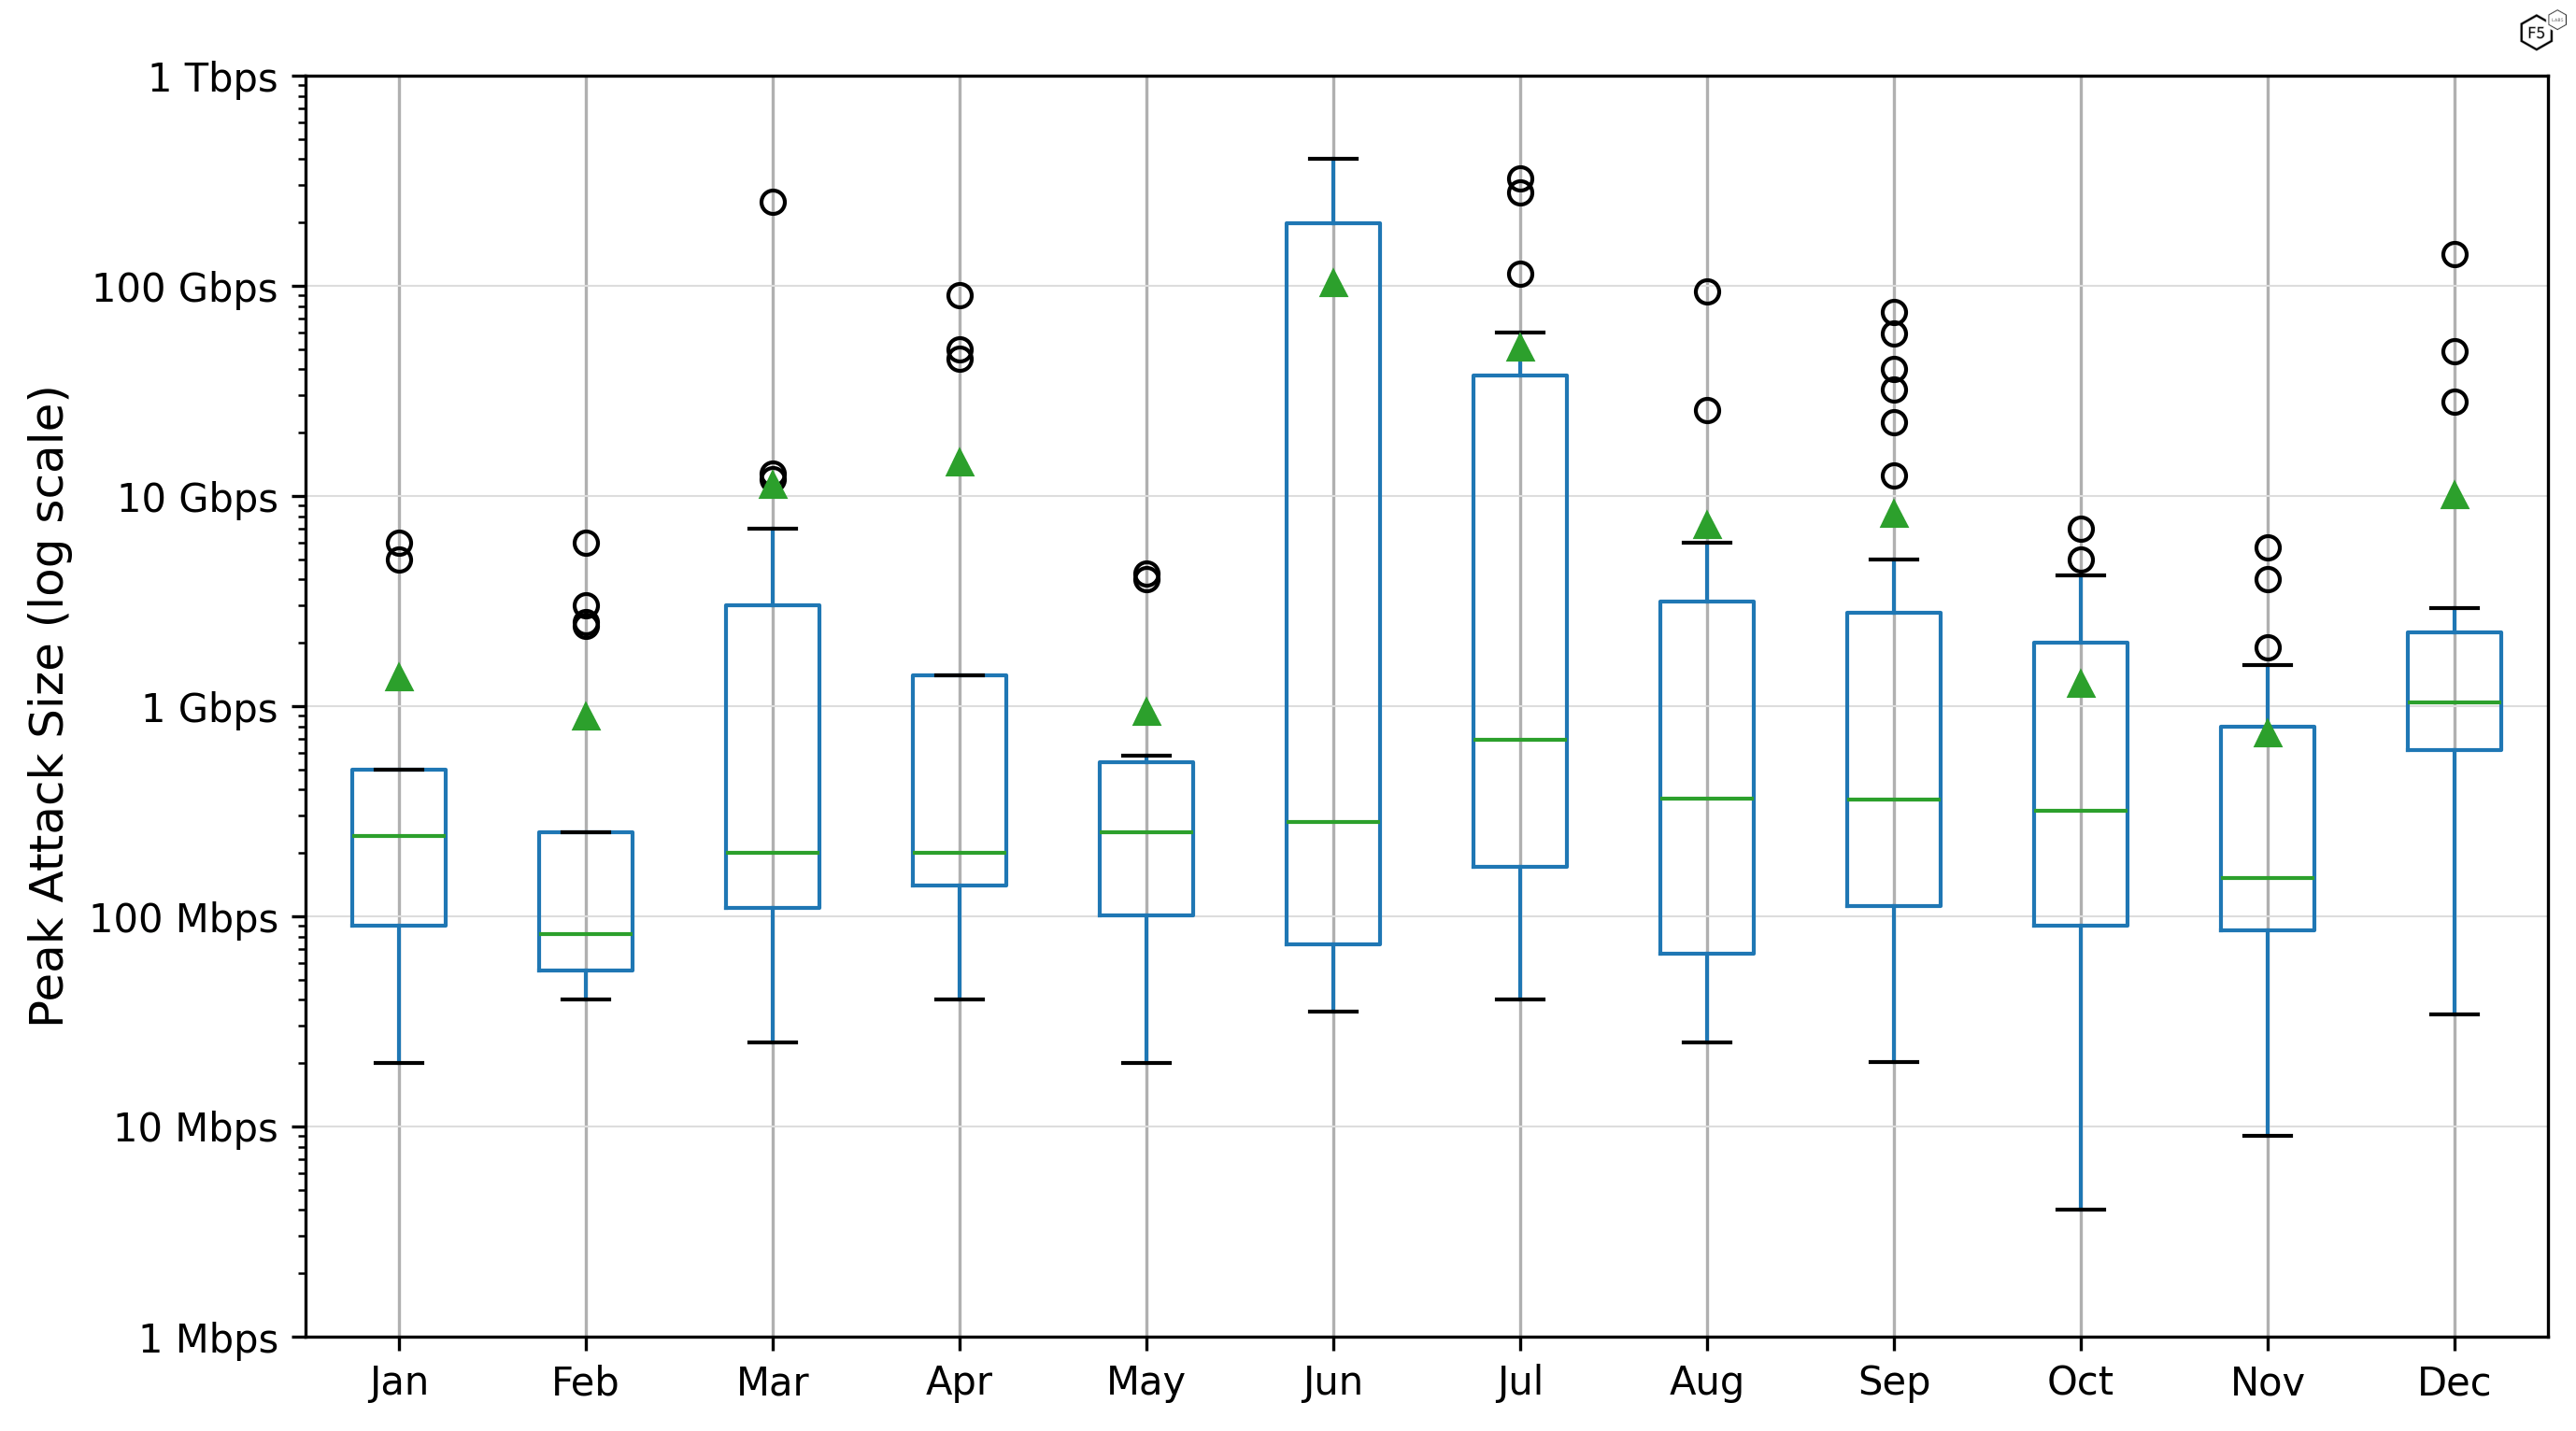
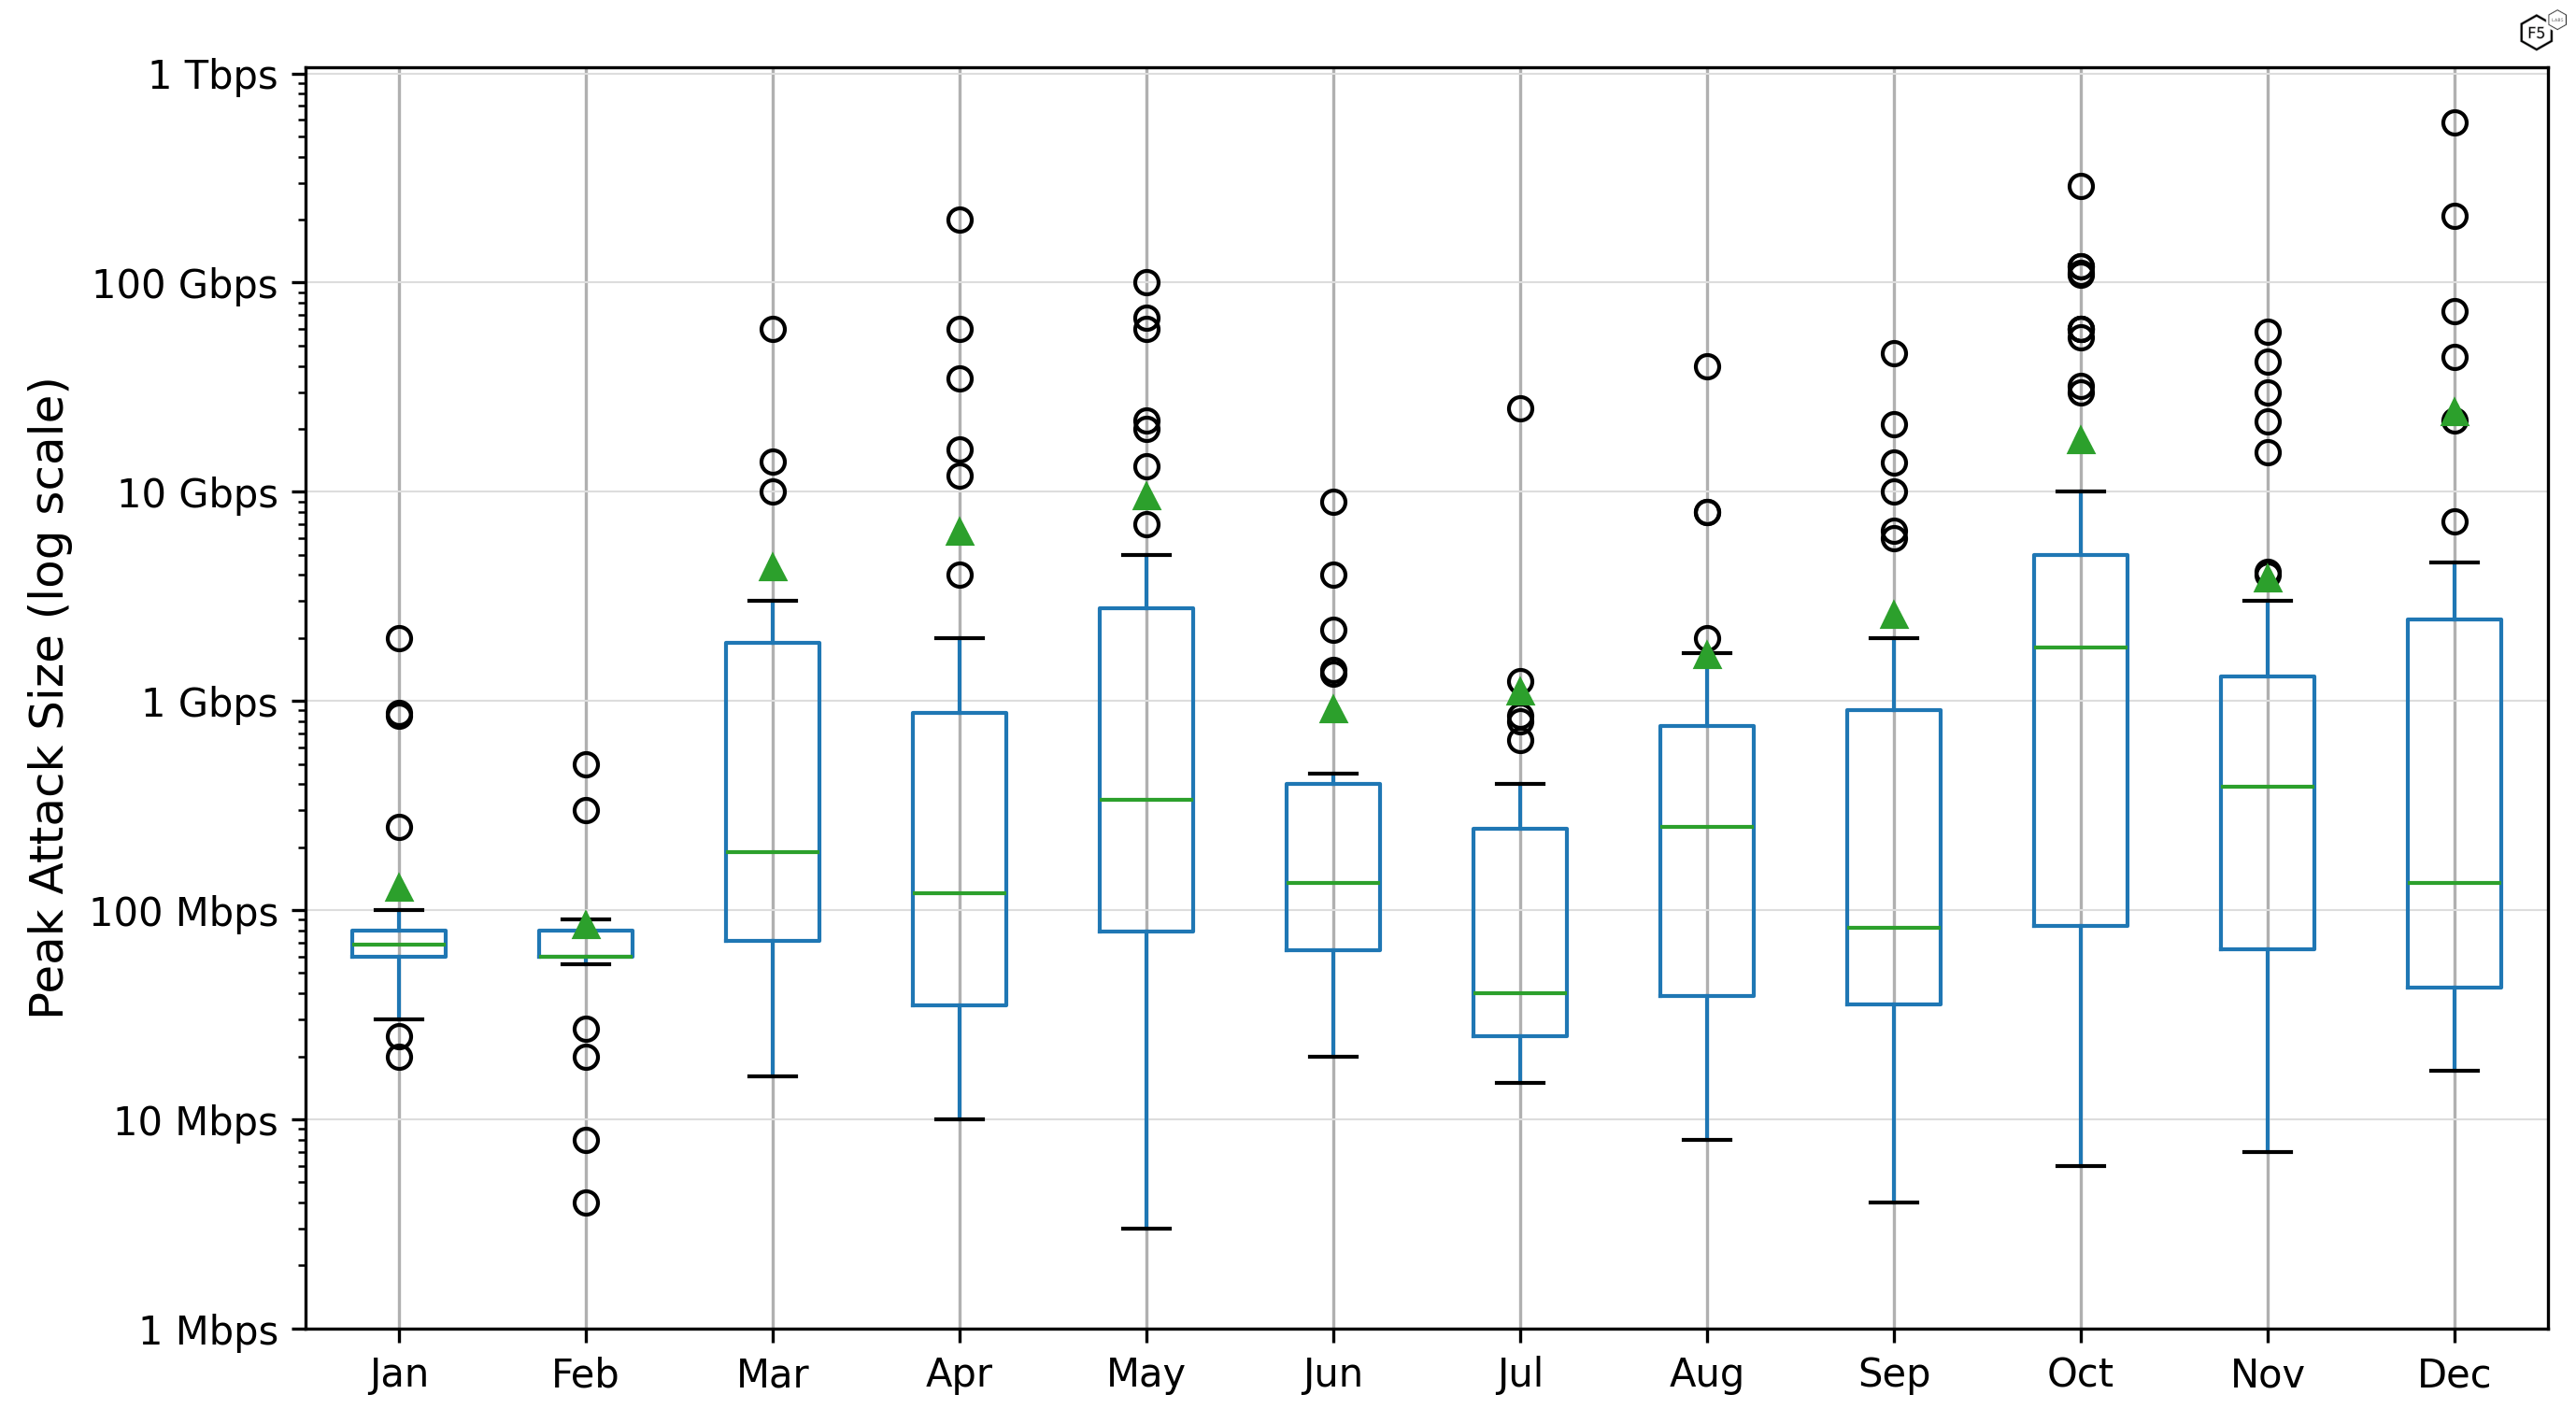
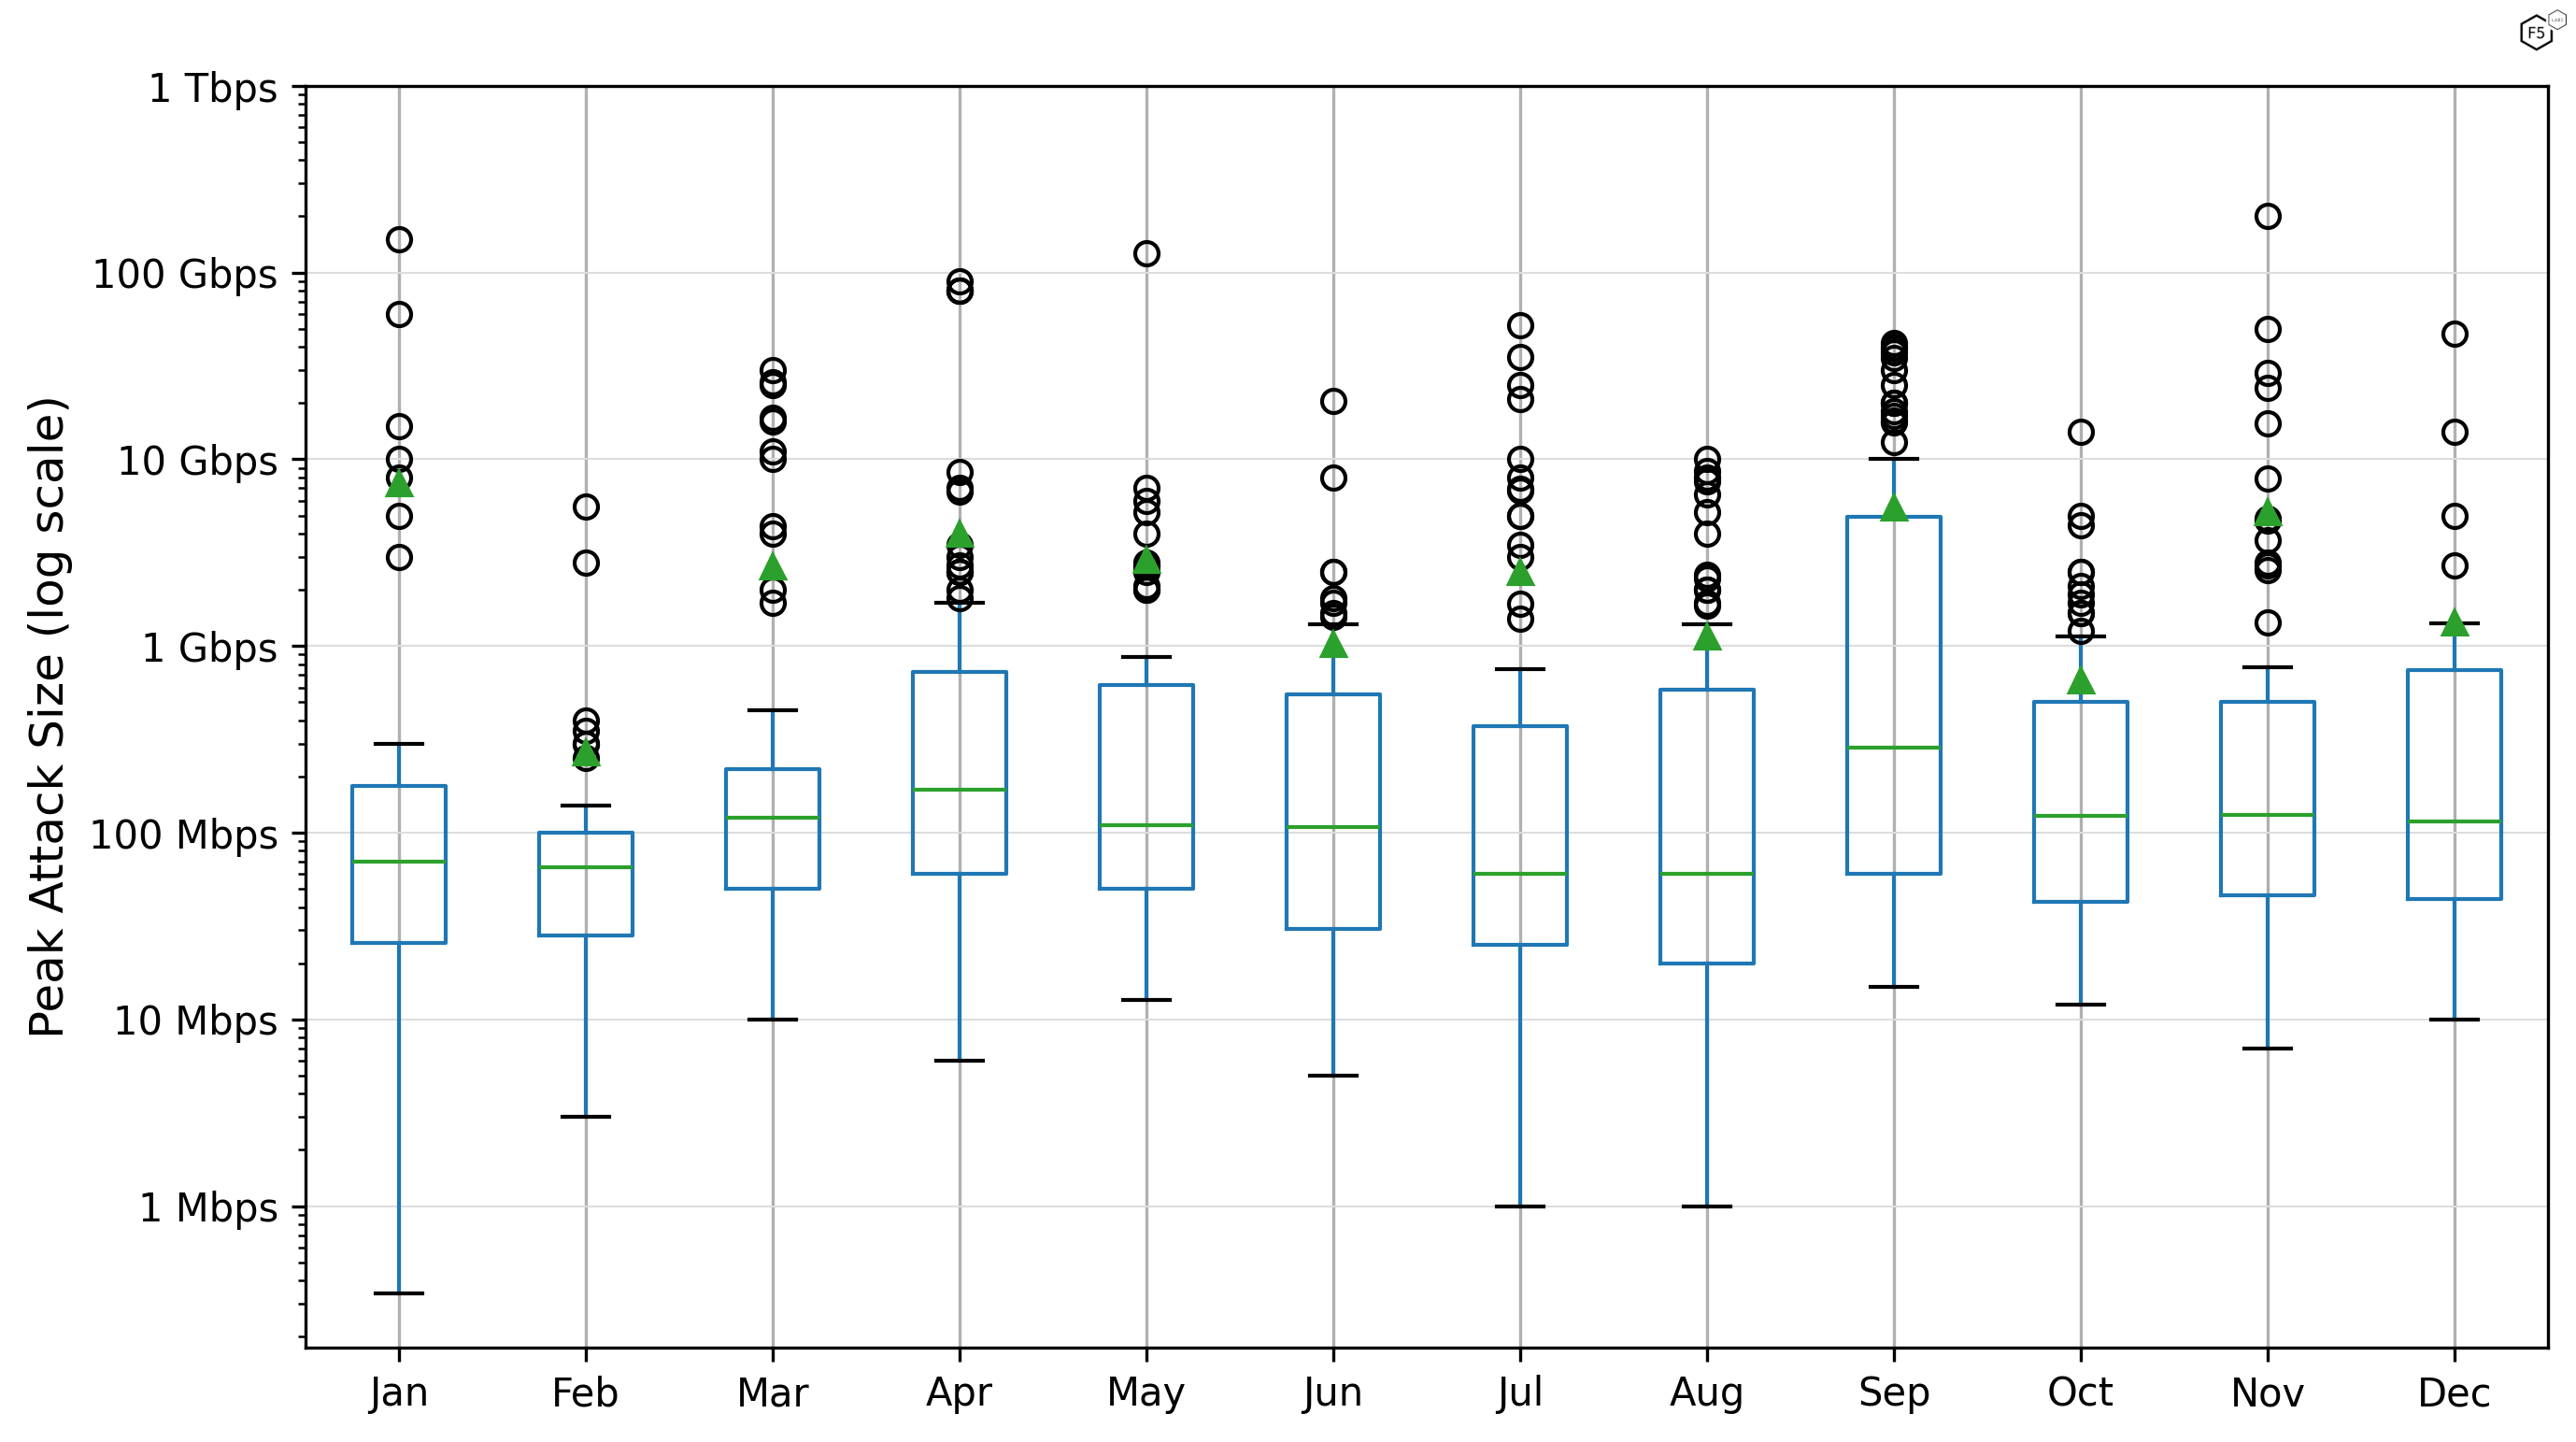
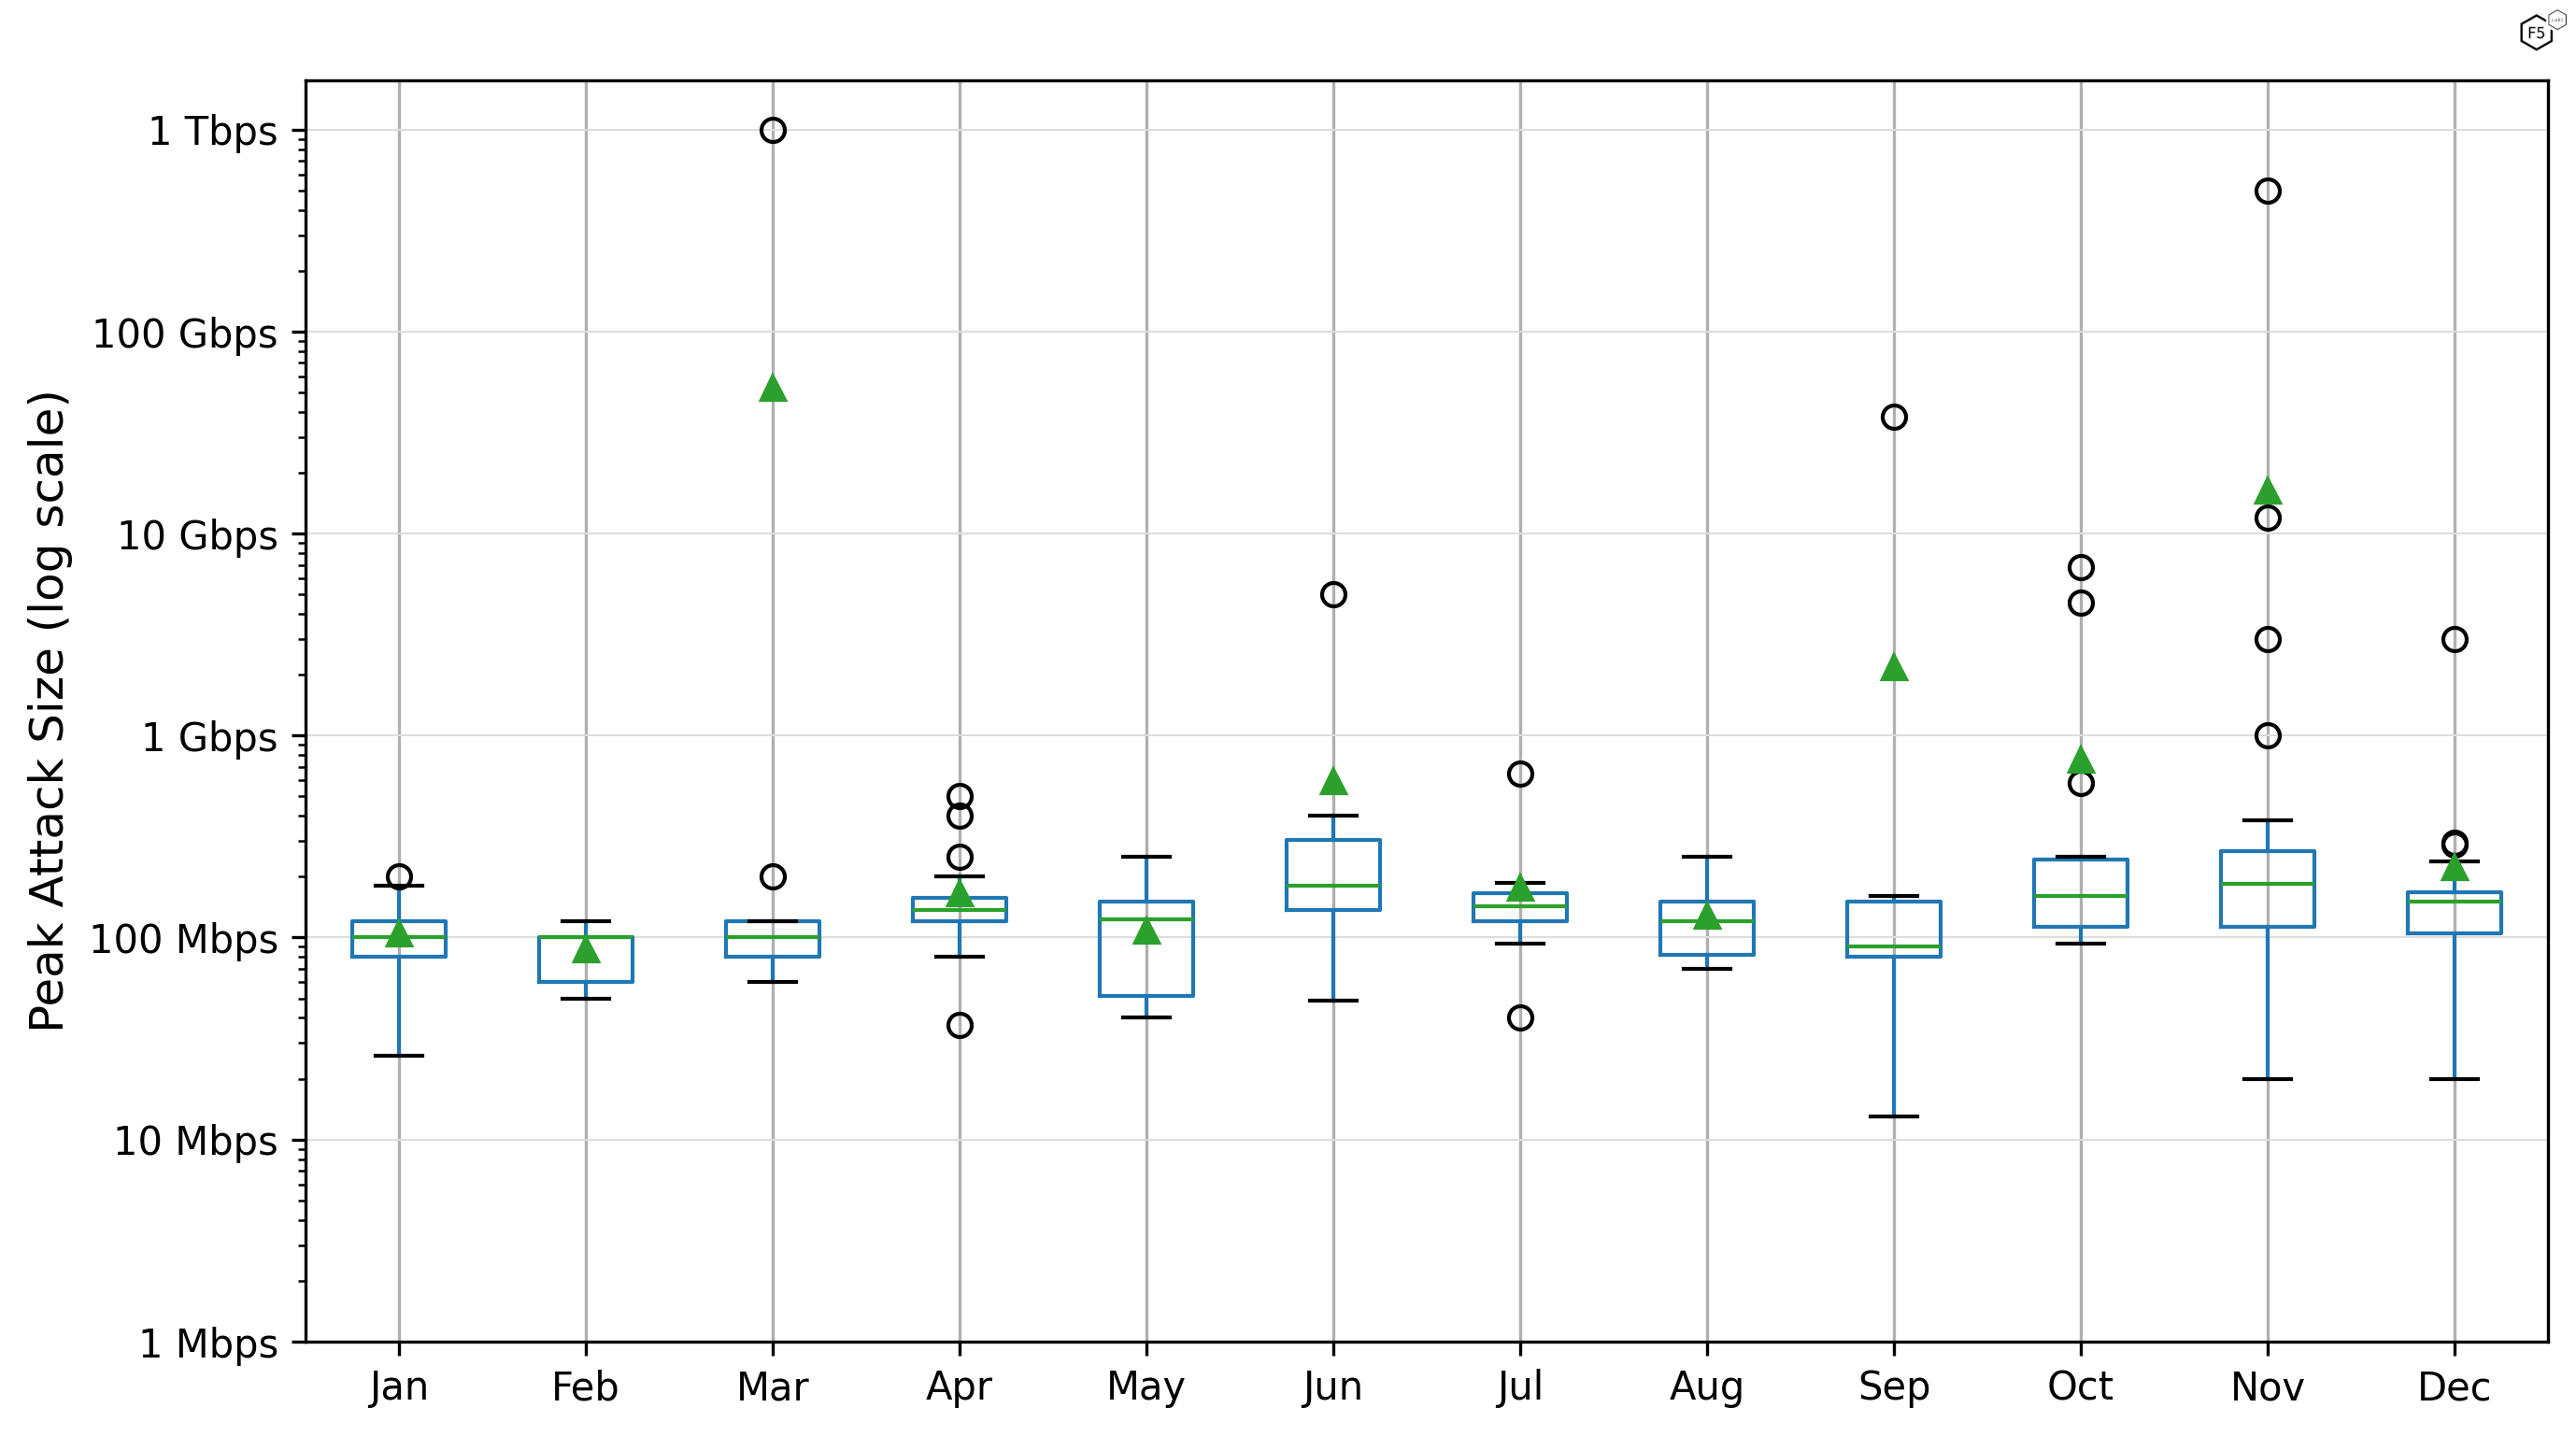
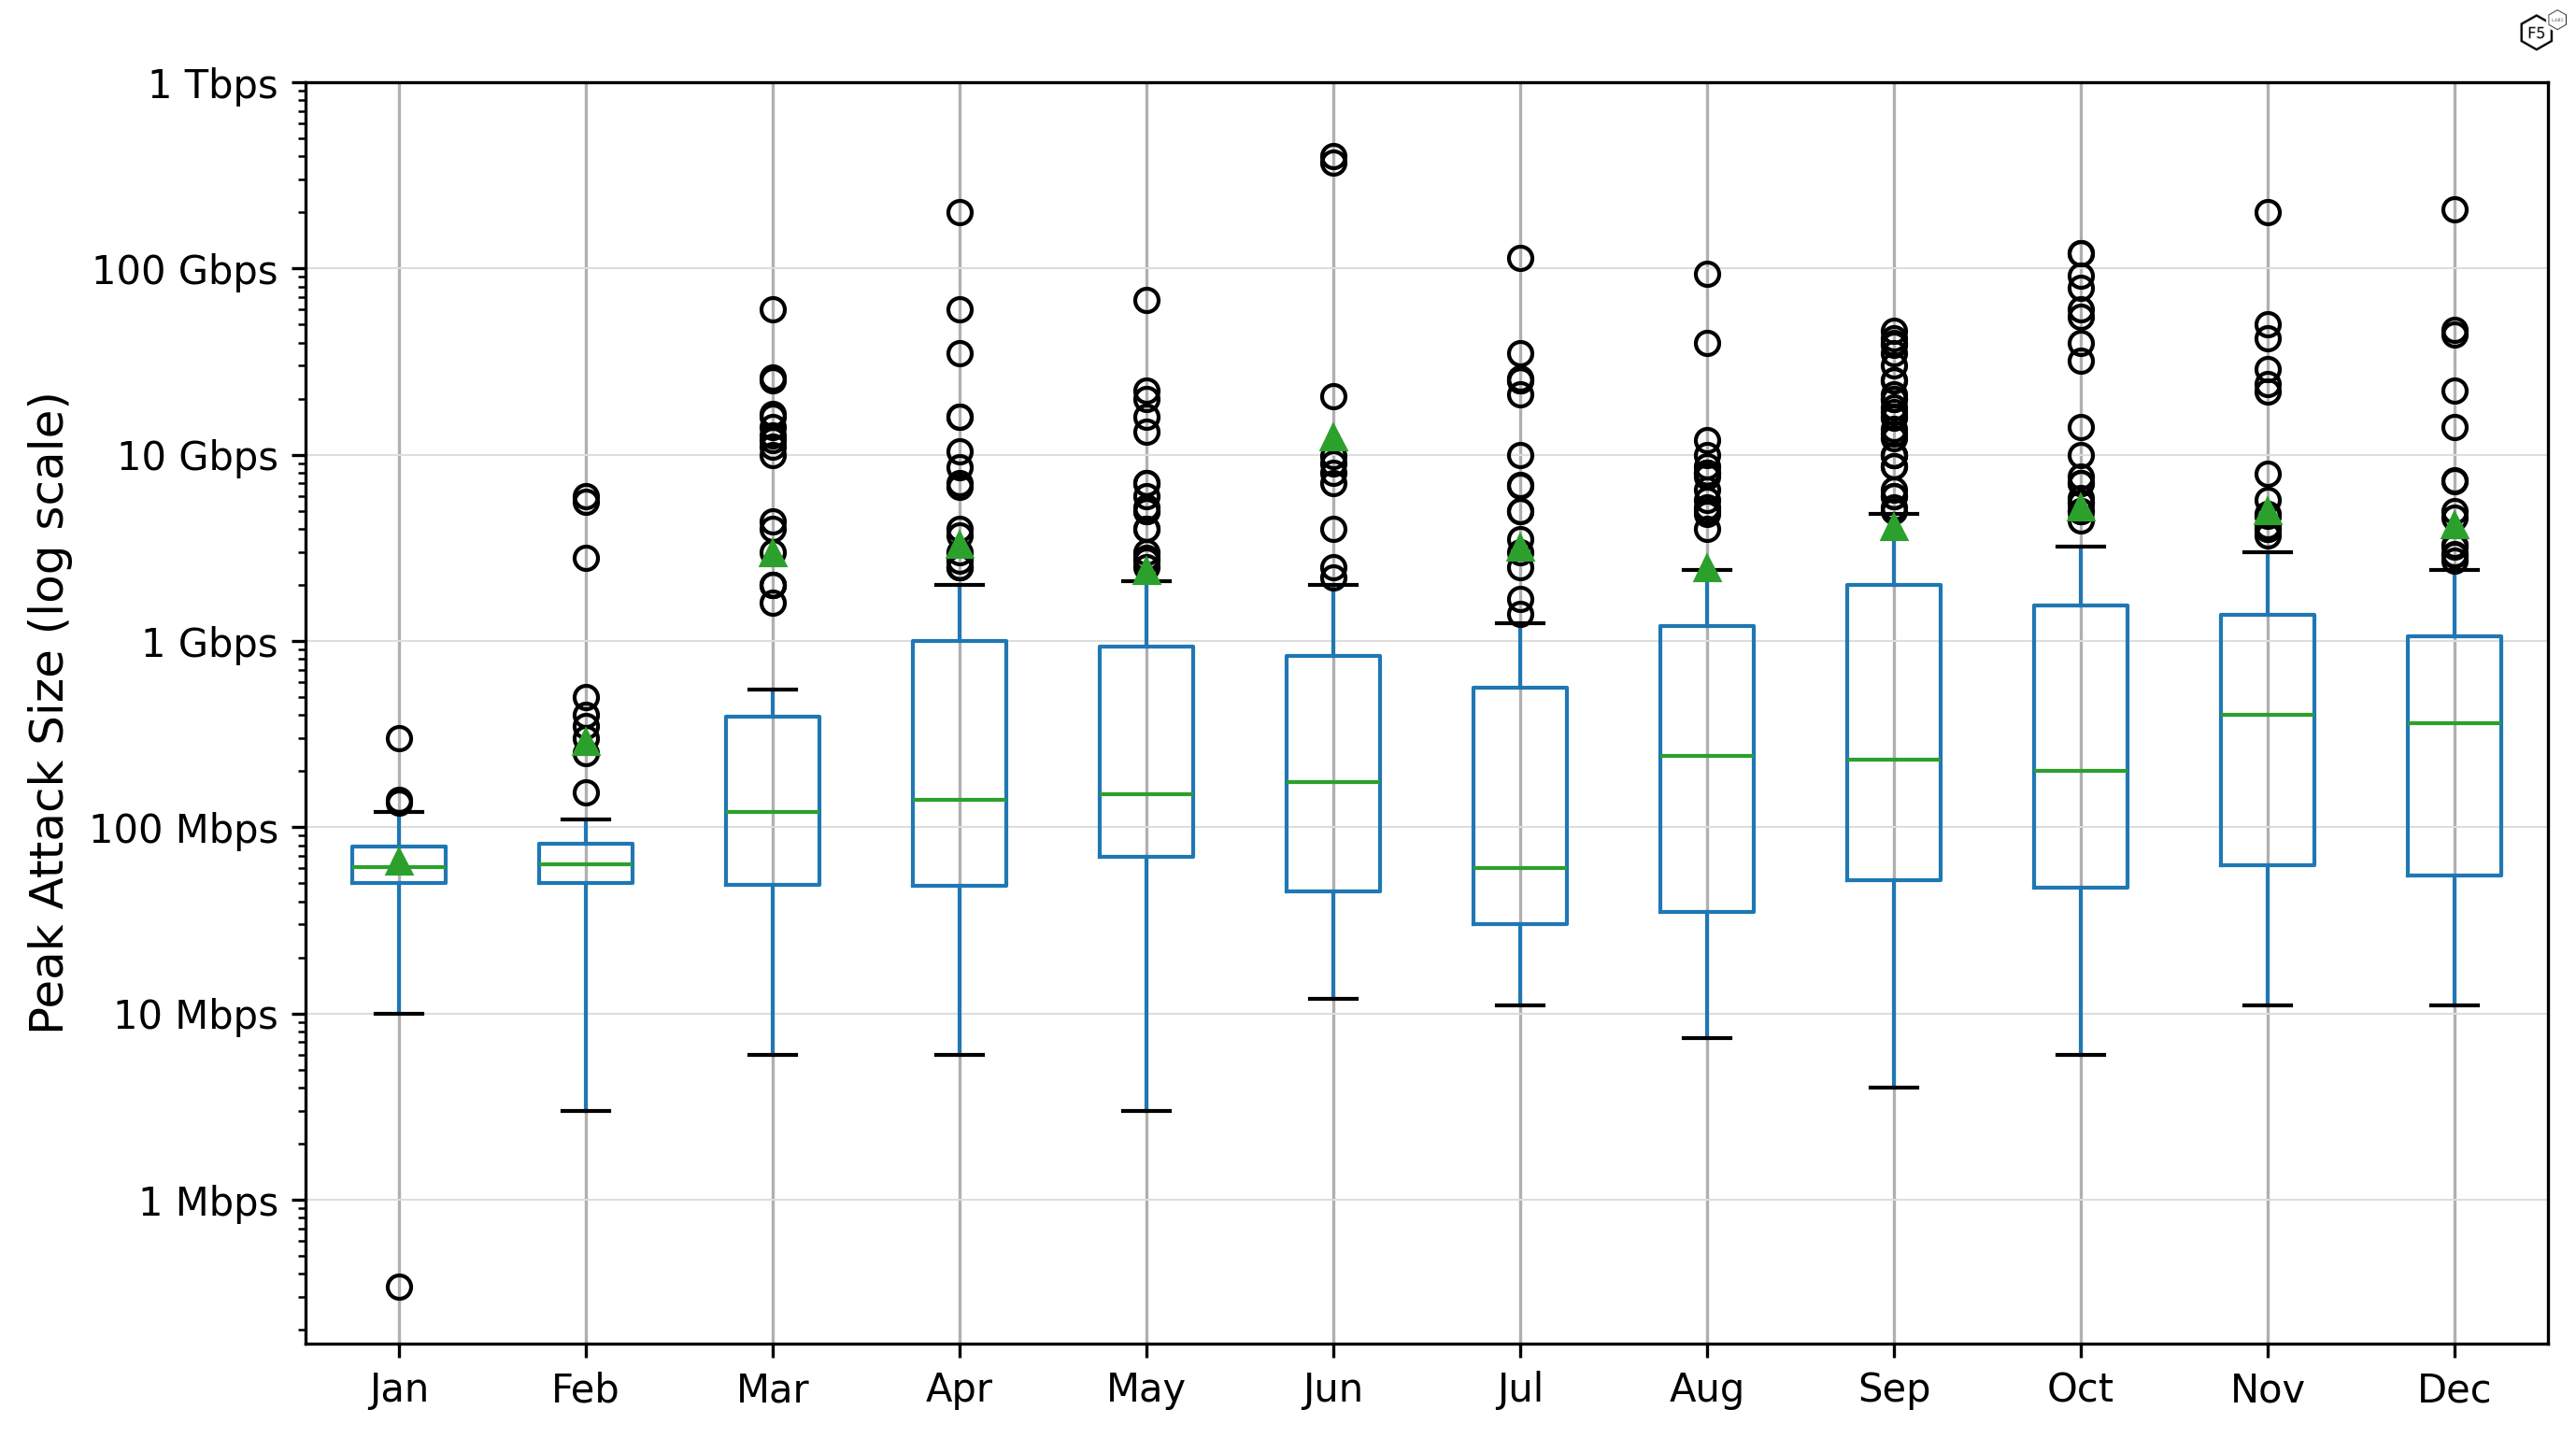
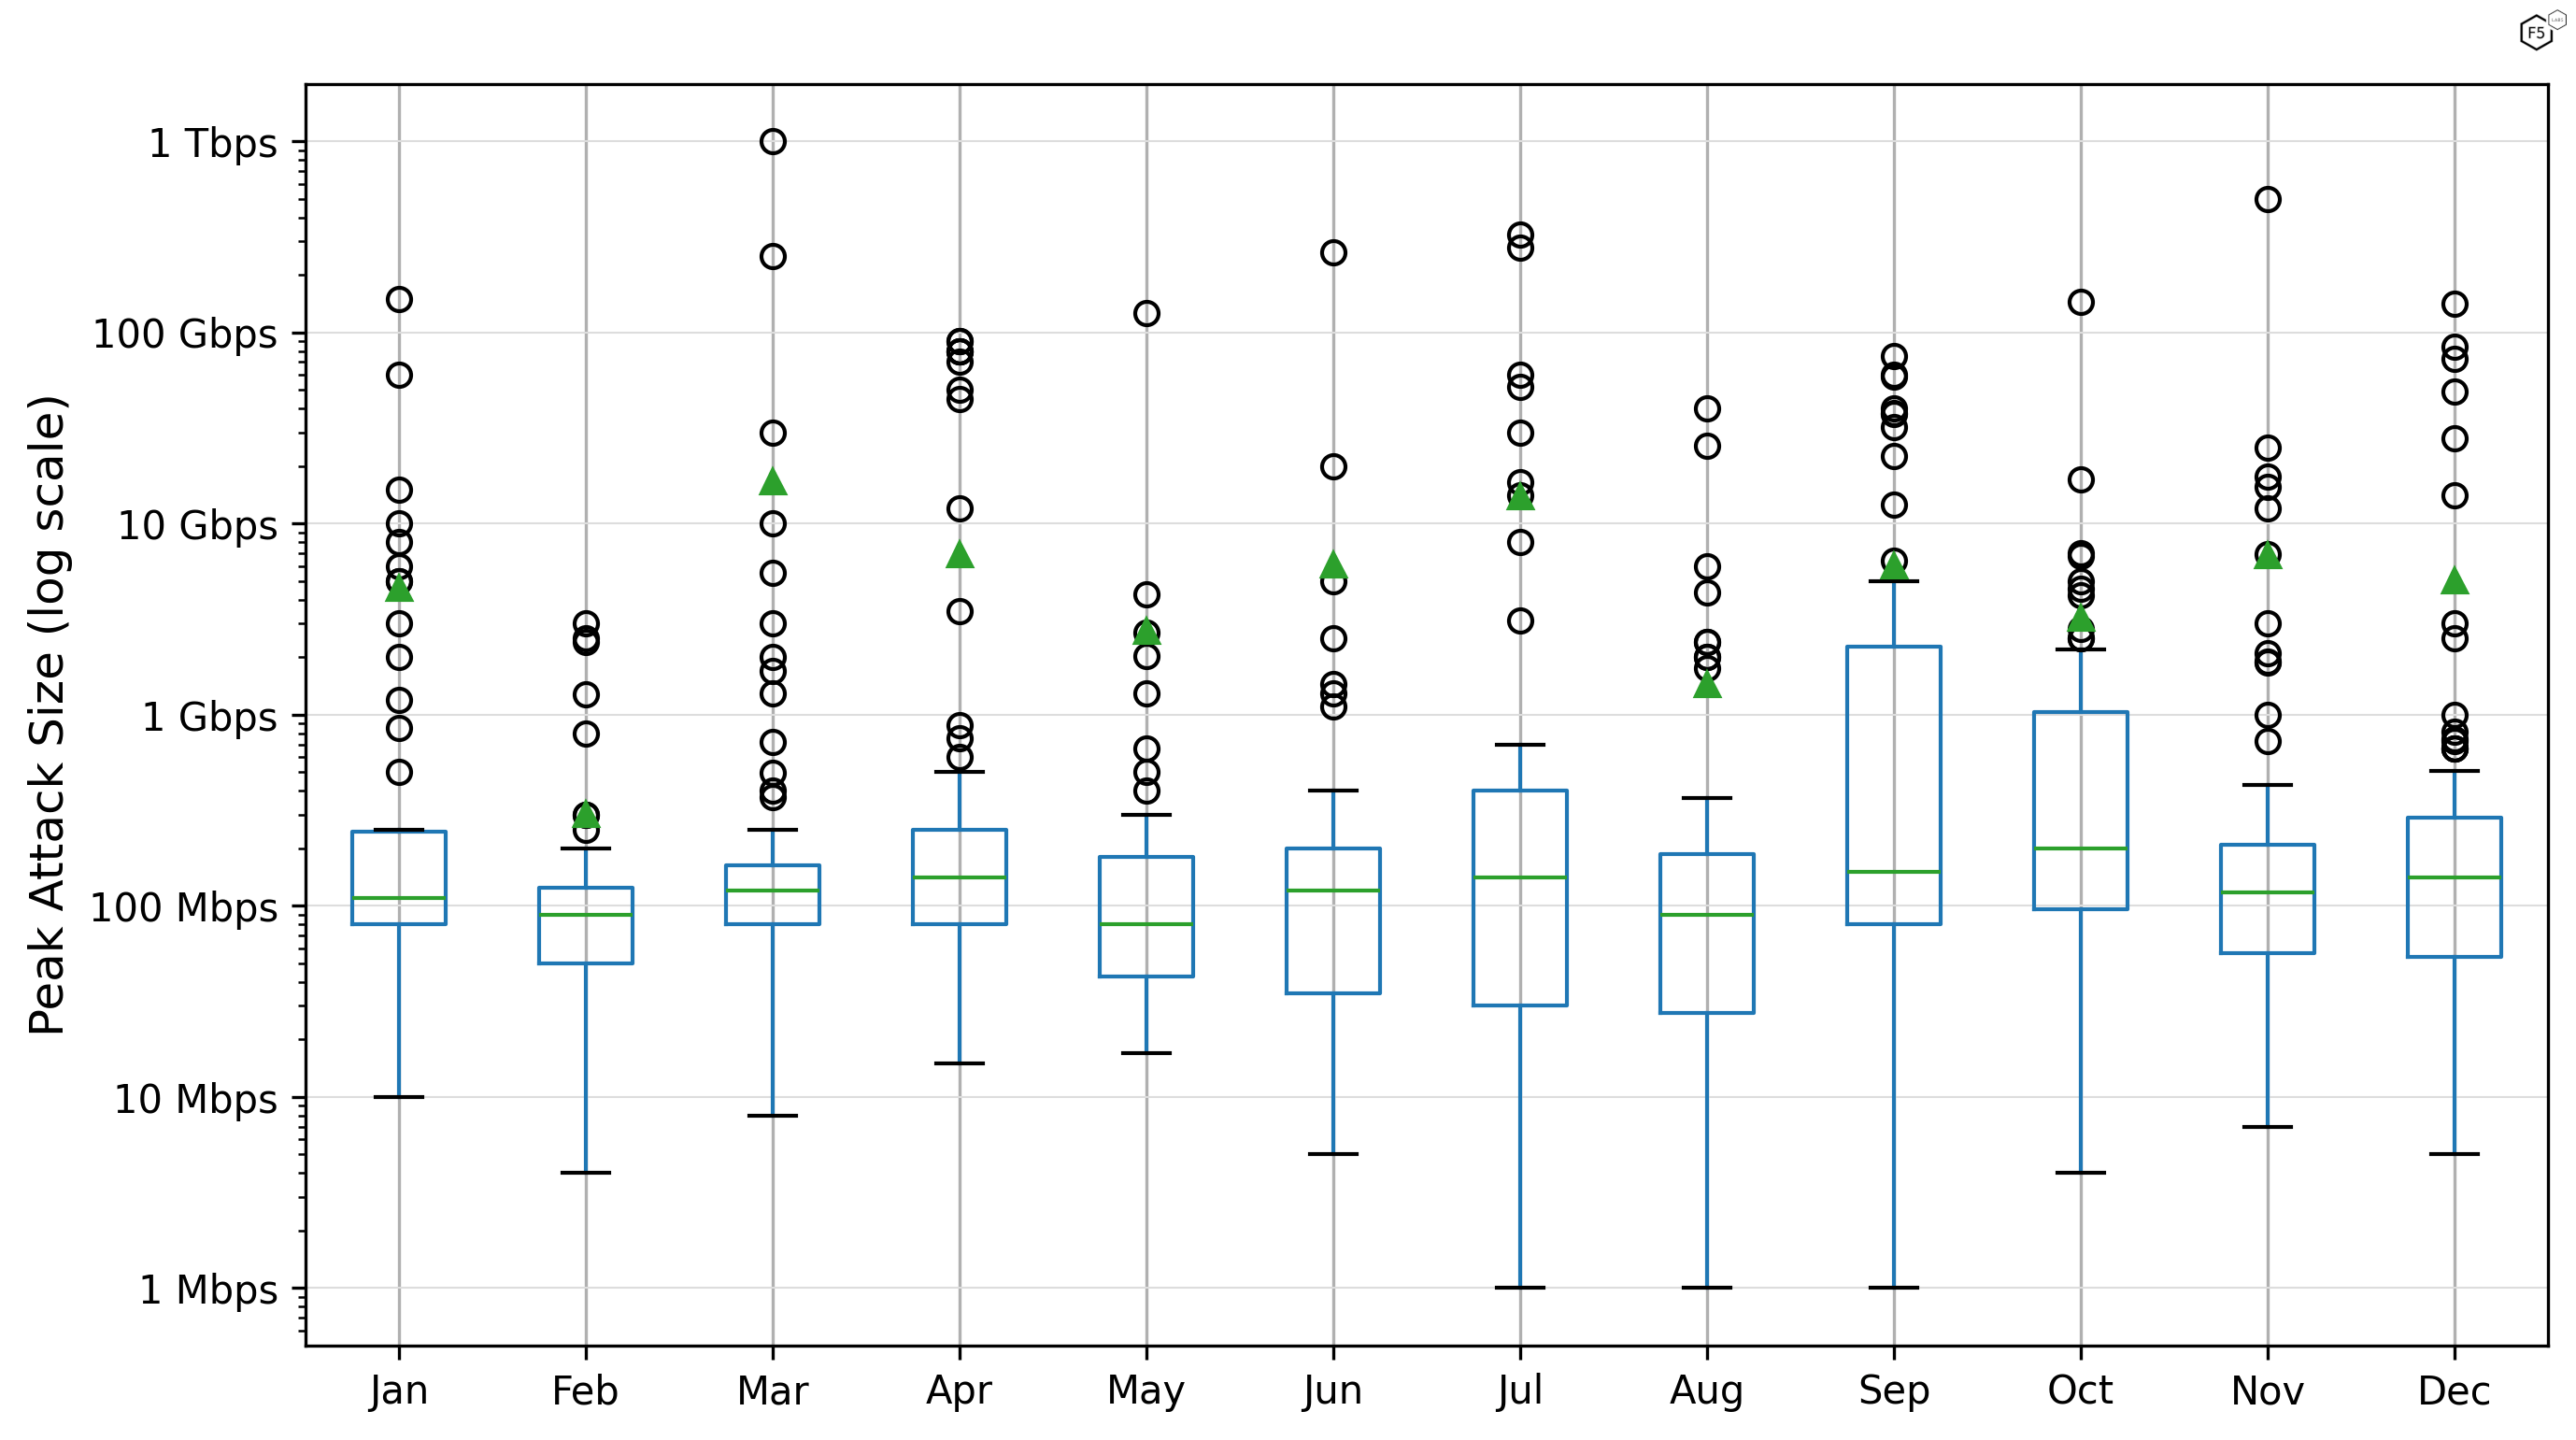
Although the F5 Distributed Cloud service hasn’t seen an incident as large as the 1.4Tbps attack which it mitigated in 2021, it came close in March 2023 when it blocked an attack reaching 1Tbps (as Figure 5). Threat actors attempted to take down the aforementioned Support Services organization with a deluge of TCP SYN packets. Most months in 2023 saw peak attack sizes of 100-200 Gbps or greater, with February being the only significant outlier, seeing only a relatively tiny 5Gbps attack.
While Figure 5 is useful to visualise largest and smallest of all attacks, the box-whisker plot is perhaps more useful to determine the most frequent attack sizes. The lower quartile of peak attack sizes varied very little throughout 2023 with the lowest 25% of attacks reaching only 30-50Mbps. However (noting the logarithmic scale on the y-axis of Figure 5) the upper quartile saw steady and significant growth, indicating the steady rise in average attack bandwidth. January’s upper quartile reached only 100Mbps with the year ending at 900Mbps attacks in December.
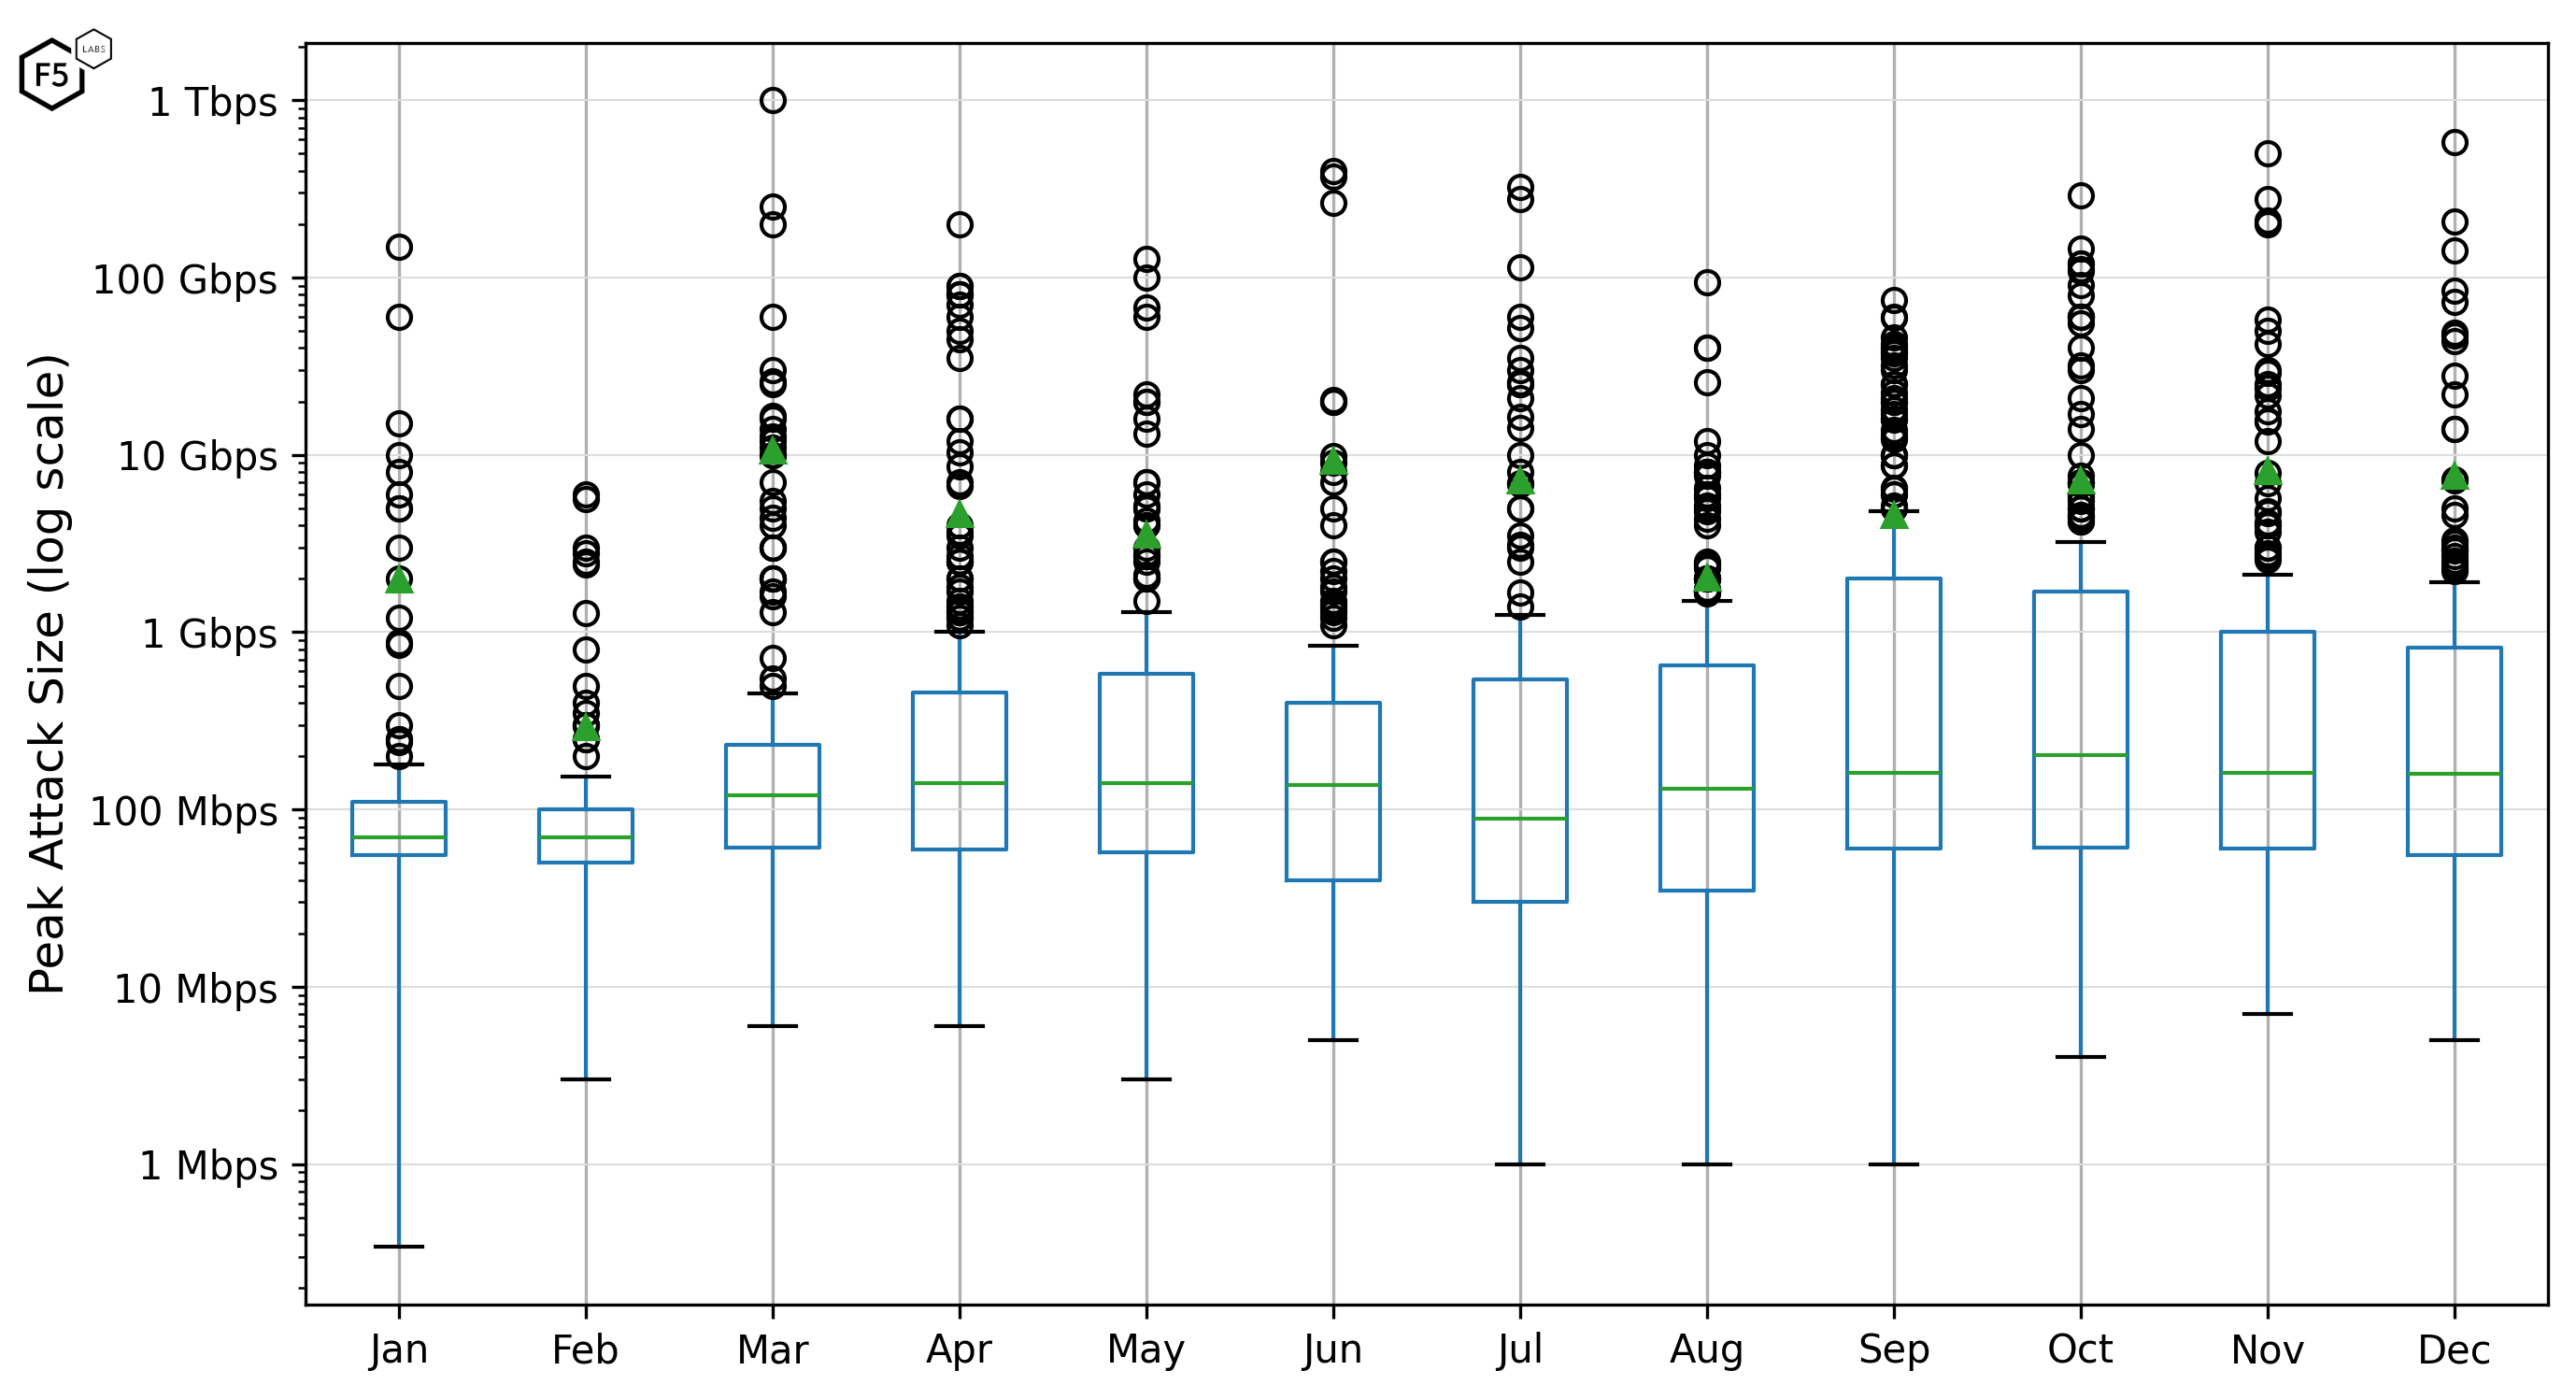
Figure 5: Box-whisker plot of attack peak bandwidth over 2023 (note the logarithmic scale on the y-axis)
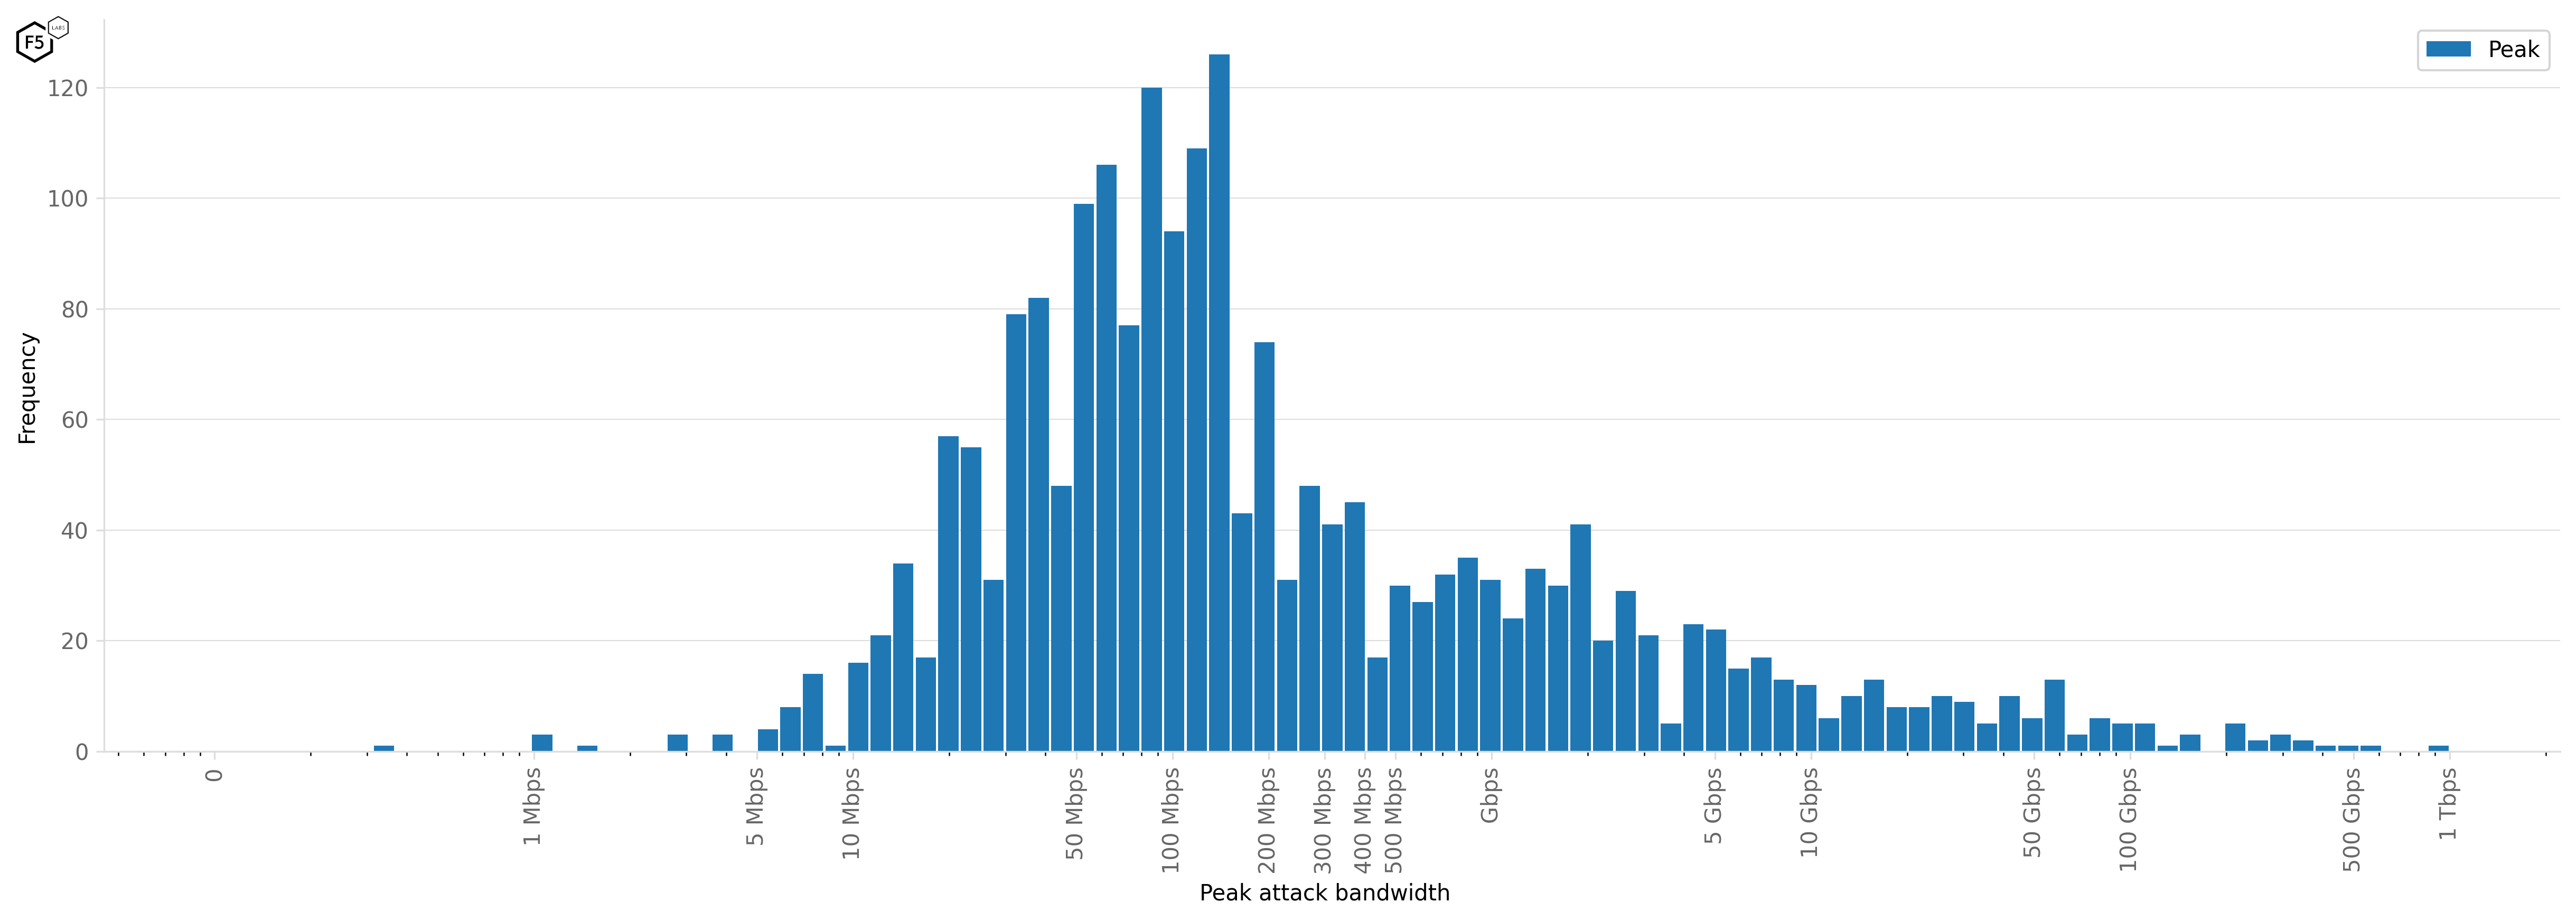
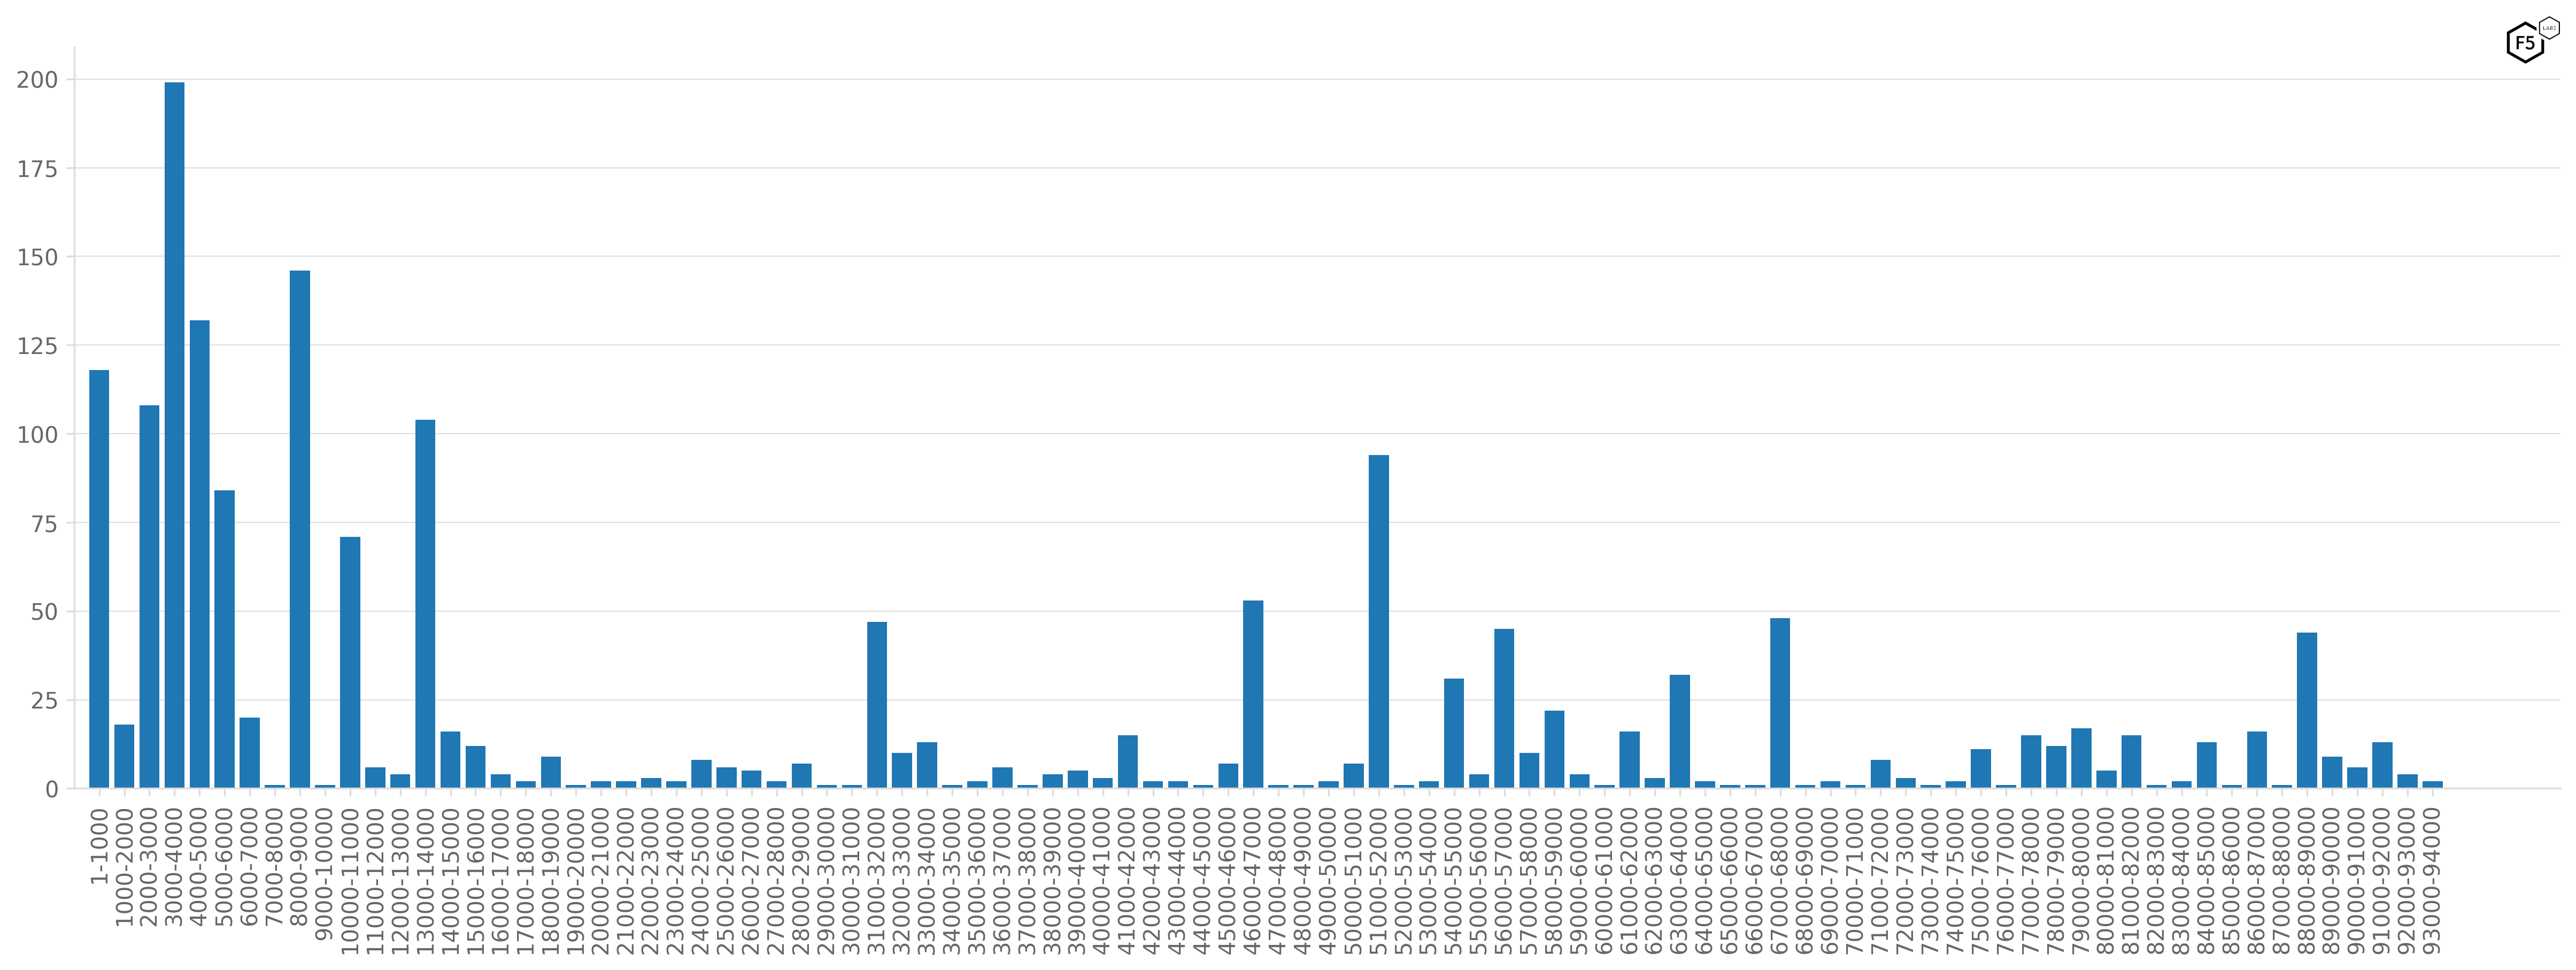
Let’s change the view to dive in to attack sizes further. The histogram in Figure 6 uses logarithmic binning on the x-axis in order visualize how often certain attack sizes occur, but what can we learn from this? Well, we can see that attacks peaking at 50-200Mbps in size are by far the most common.